Spend Analysis: Best Practices
Learn how to conduct spending analysis to identify unnecessary expenses and underperforming suppliers. You can't optimize it when you don't see it!
Where should you start when you want to create budgets, cut costs, or forecast future spending? The answer is simple: spend analysis. After all, a clear picture of the company's procurement process is necessary to develop a sustainable future strategy and to avoid pitfalls that hold your business back.
Read on to learn all you need to know about the definition, benefits, types, steps of implementation, and success tips for spend analysis.
Keep reading to find out:
- What Is the Spend Analysis Process?
- Benefits of Spend Analysis
- Key Performance Indicators
- Types of Spend Analysis
- How to Conduct Spend Analysis
- Common Setbacks of Spend Analysis
- The Secret to Successful Spend Analysis
- Frequently Asked Questions
What Is the Spend Analysis Process?
Spend analysis is the practice of collecting, examining, and visualizing spend data. It includes several steps: from identifying business goals to finding ways to cut off extra expenses and improve forecasting.
Spend analysis involves spend visibility, spending review, and procurement process improvement. Spend analysis is extremely useful for companies looking to optimize their business processes because it highlights issues like unidentified, duplicate, and late payments, unnecessary department spending, supplier price discrepancies, redundancies, unfavorable contract and payment terms, and more.
Spend analysis is a crucial part of the broader business practice of procurement analysis and spend management. A clear picture of the company's expenditures is essential for fact-based decisions in strategic sourcing and supplier management.
Benefits of Spend Analysis
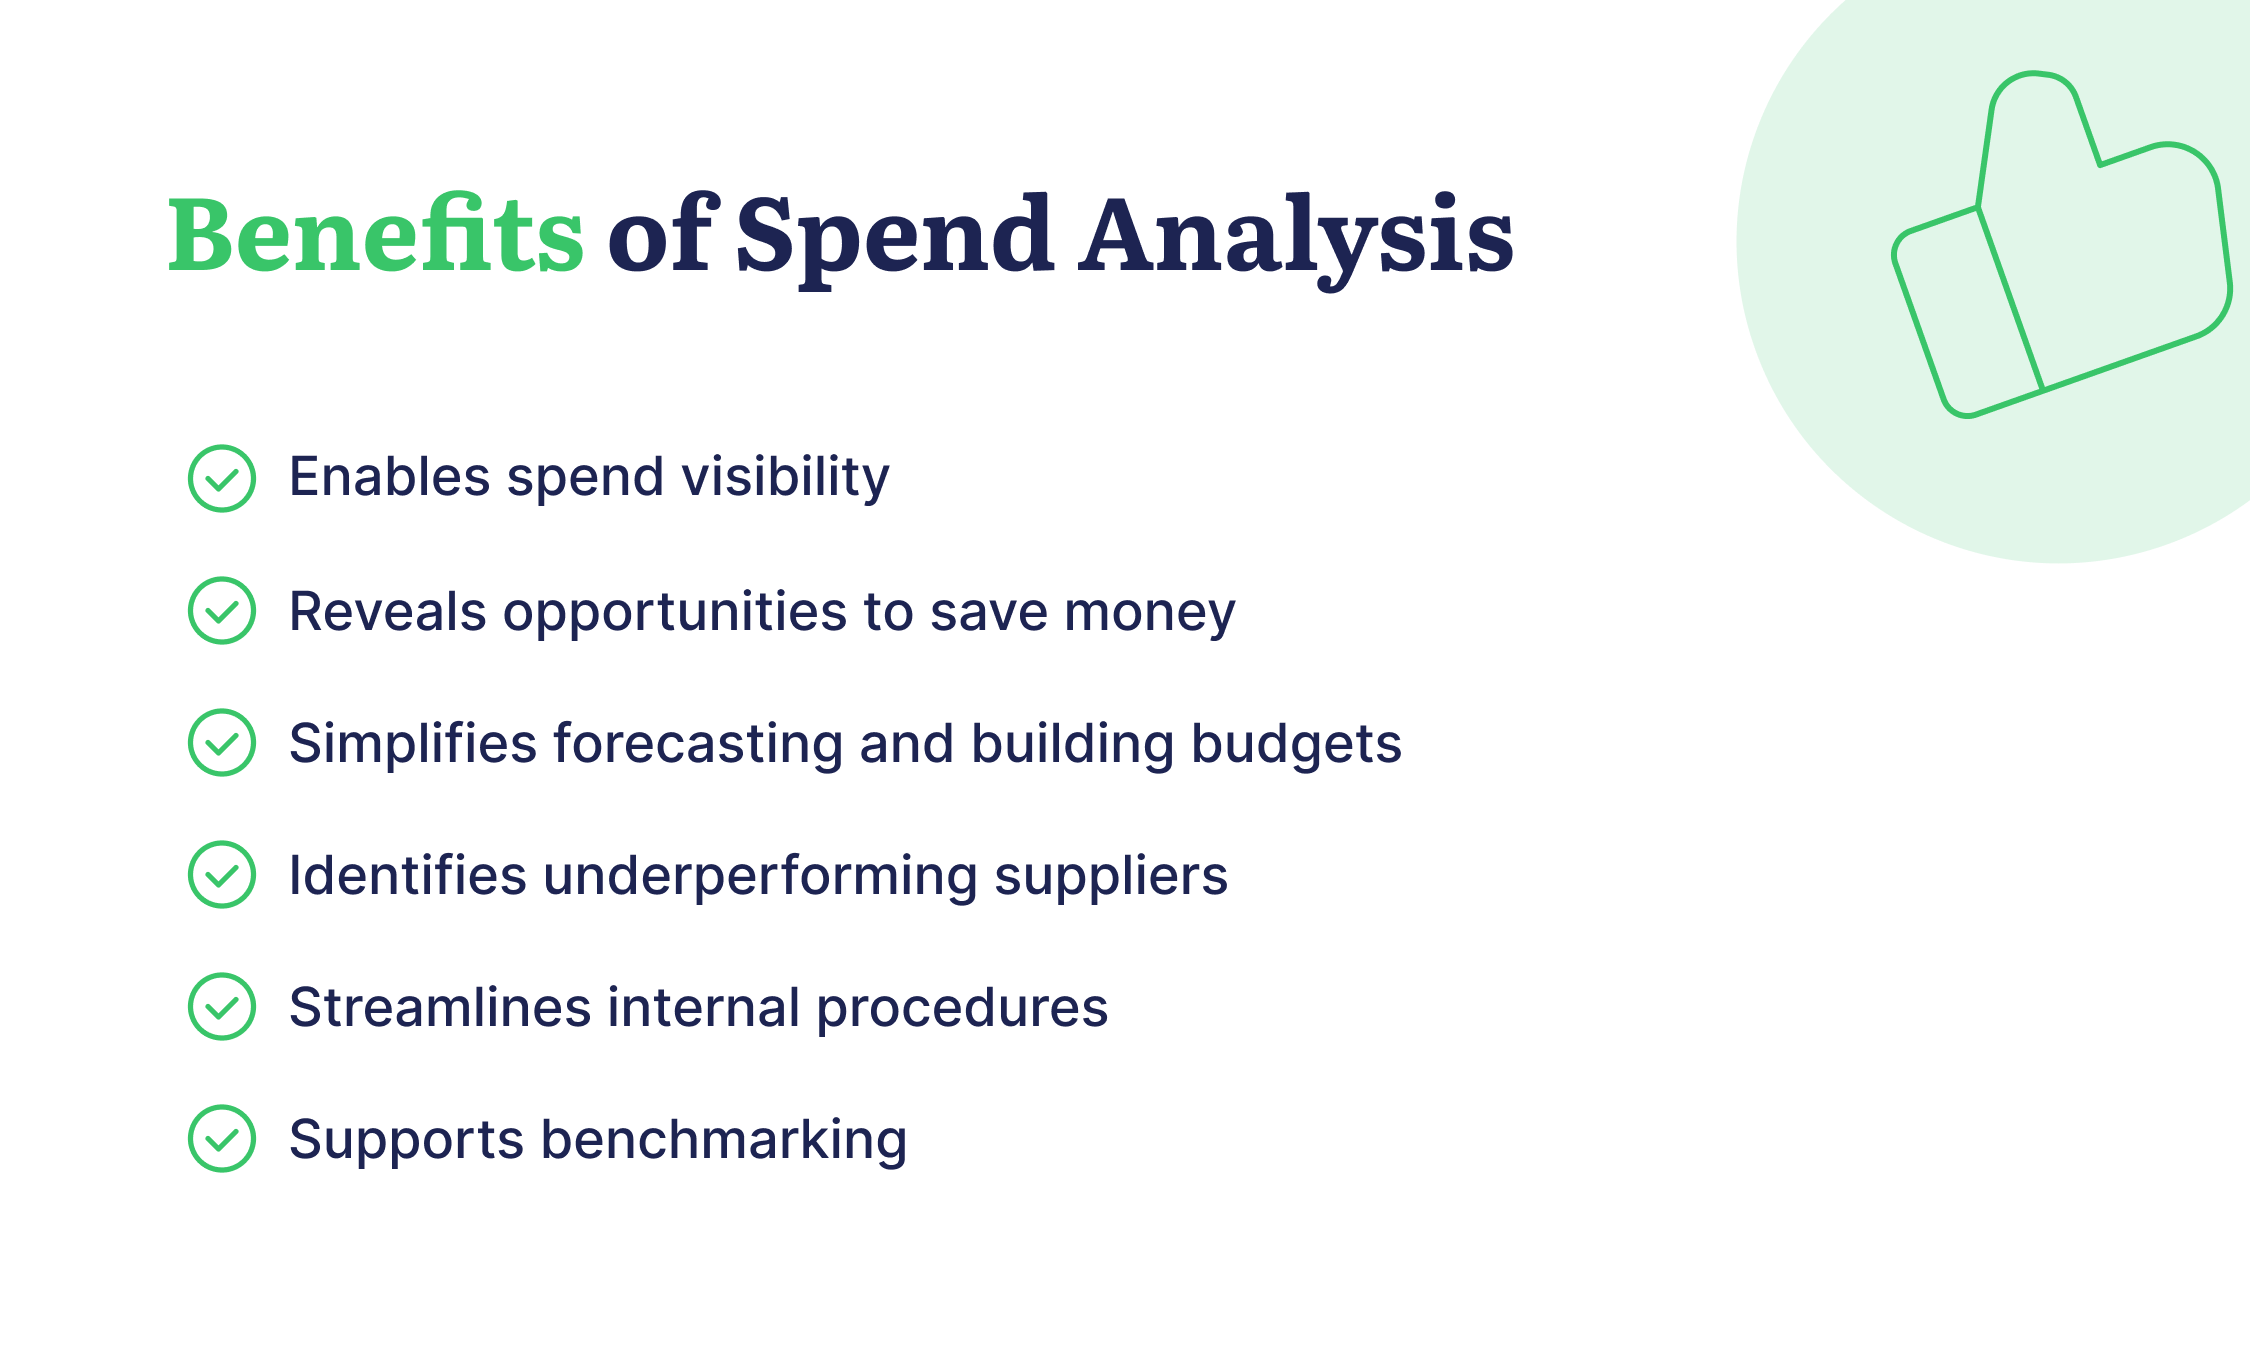
Enables Spend Visibility
First and foremost, spend analysis helps companies achieve transparency when it comes to how much money is spent and on what items. It also reveals insights about suppliers and the terms business is conducted under.
This awareness helps organizations understand the strengths and weaknesses of their procurement process. For instance, a company may discover that it has ignored better sourcing opportunities due to a lack of information and overlooking peripheral costs.
Once decision-makers understand the company's expenditures, they can make informed business decisions and set achievable goals.
Reveals Opportunities to Save Money
The amount of money a company can save after discovering and eliminating a range of cost-inefficient patterns might surprise you. Let's consider some habits that waste money:
- Maverick spending: purchasing services and goods from unapproved suppliers with no negotiated contract pricing
- Duplicate payments for a single invoice
- Late fees that make a company unreliable in the eyes of suppliers and frequently lead to late payment penalties
- Unnecessary department spending: workers of different departments may separately pay for the same subscriptions or items
After identifying relevant spending problems, companies can find cost-reduction opportunities without disrupting the supply chain. For instance, they can spot goods and services that don't directly affect the final product while taking up a considerable amount of money. Then, companies can benefit by substituting these items for cheaper solutions.
Simplifies Forecasting and Building Budgets
Accurate data on past expenses increases the chances of precise forecasting and makes it easier to set up realistic budgets in the future.
You'll be able to track the financial results of past business decisions and identify unforeseen expenses that drained your previous budgets. Informed means armed!
Identifies Underperforming Suppliers
Comprehensive spend analysis helps companies assess supplier credibility and verify whether they're compliant with contracts. Have there been any missed or late deliveries or poor handling of complaints? Is the quality of goods or services inconsistent? What about any other problems?
These questions should be answered before rushing into new agreements with a current supplier. If the answer to any of them points to problems, it might be time to explore other sourcing options. It's always better to have a small number of suppliers that cover all your needs and have proved to be reliable partners instead of retaining a long list of vendors.
Of course, it might also be possible to discuss the issues mentioned above with active suppliers and fix them; this may even open the door for discounts or better payment terms.
Streamlines Internal Procedures
Spending data analysis sheds light on similar purchases between different departments. It enables them to cooperate even more closely to create fewer purchase orders and get things done faster by grouping multiple items and services into one purchase.
Filing financial reports also takes less time with access to verified and unified data. In addition, studying supplier performance together with contract terms and examining their effects on the company helps to establish a set of requirements that the supplier should meet so the organization gains value from cooperation with them.
Supports Benchmarking
Benchmarking is the process of measuring a company's performance against its competitors to identify areas that might need improvement.
Many factors may be used for conducting comparisons. For instance, Spending as a Percentage of Revenue is an important metric that can showcase whether an organization spends more money while getting the same or even worse results than similar companies in the industry.
It's also possible to conduct internal comparisons between locations and departments to establish a more transparent and nuanced understanding of business operations.
When trying to measure their accomplishments, companies may use key performance indicators. Let's learn more about them.
Key Performance Indicators
Key Performance Indicators (KPIs) are specific metrics that track a company's progress toward its goals and help assess the effectiveness of internal processes.
There are plenty of KPI categories and types. The information they reveal helps companies evaluate their own decisions in order to make smarter ones in the future.
It's important to note that organizations don't spend resources tracking every single KPI but instead take some steps to identify the ones most important to their business. Companies define their goals, and only after that do they decide what indicators will help measure their progress.
By looking at KPIs regularly, companies can determine how well they are doing in terms of their objectives. We've already seen one example of a KPI in the previous section — Spending as a Percentage of Revenue. Let's consider other relevant KPIs for spending analysis.
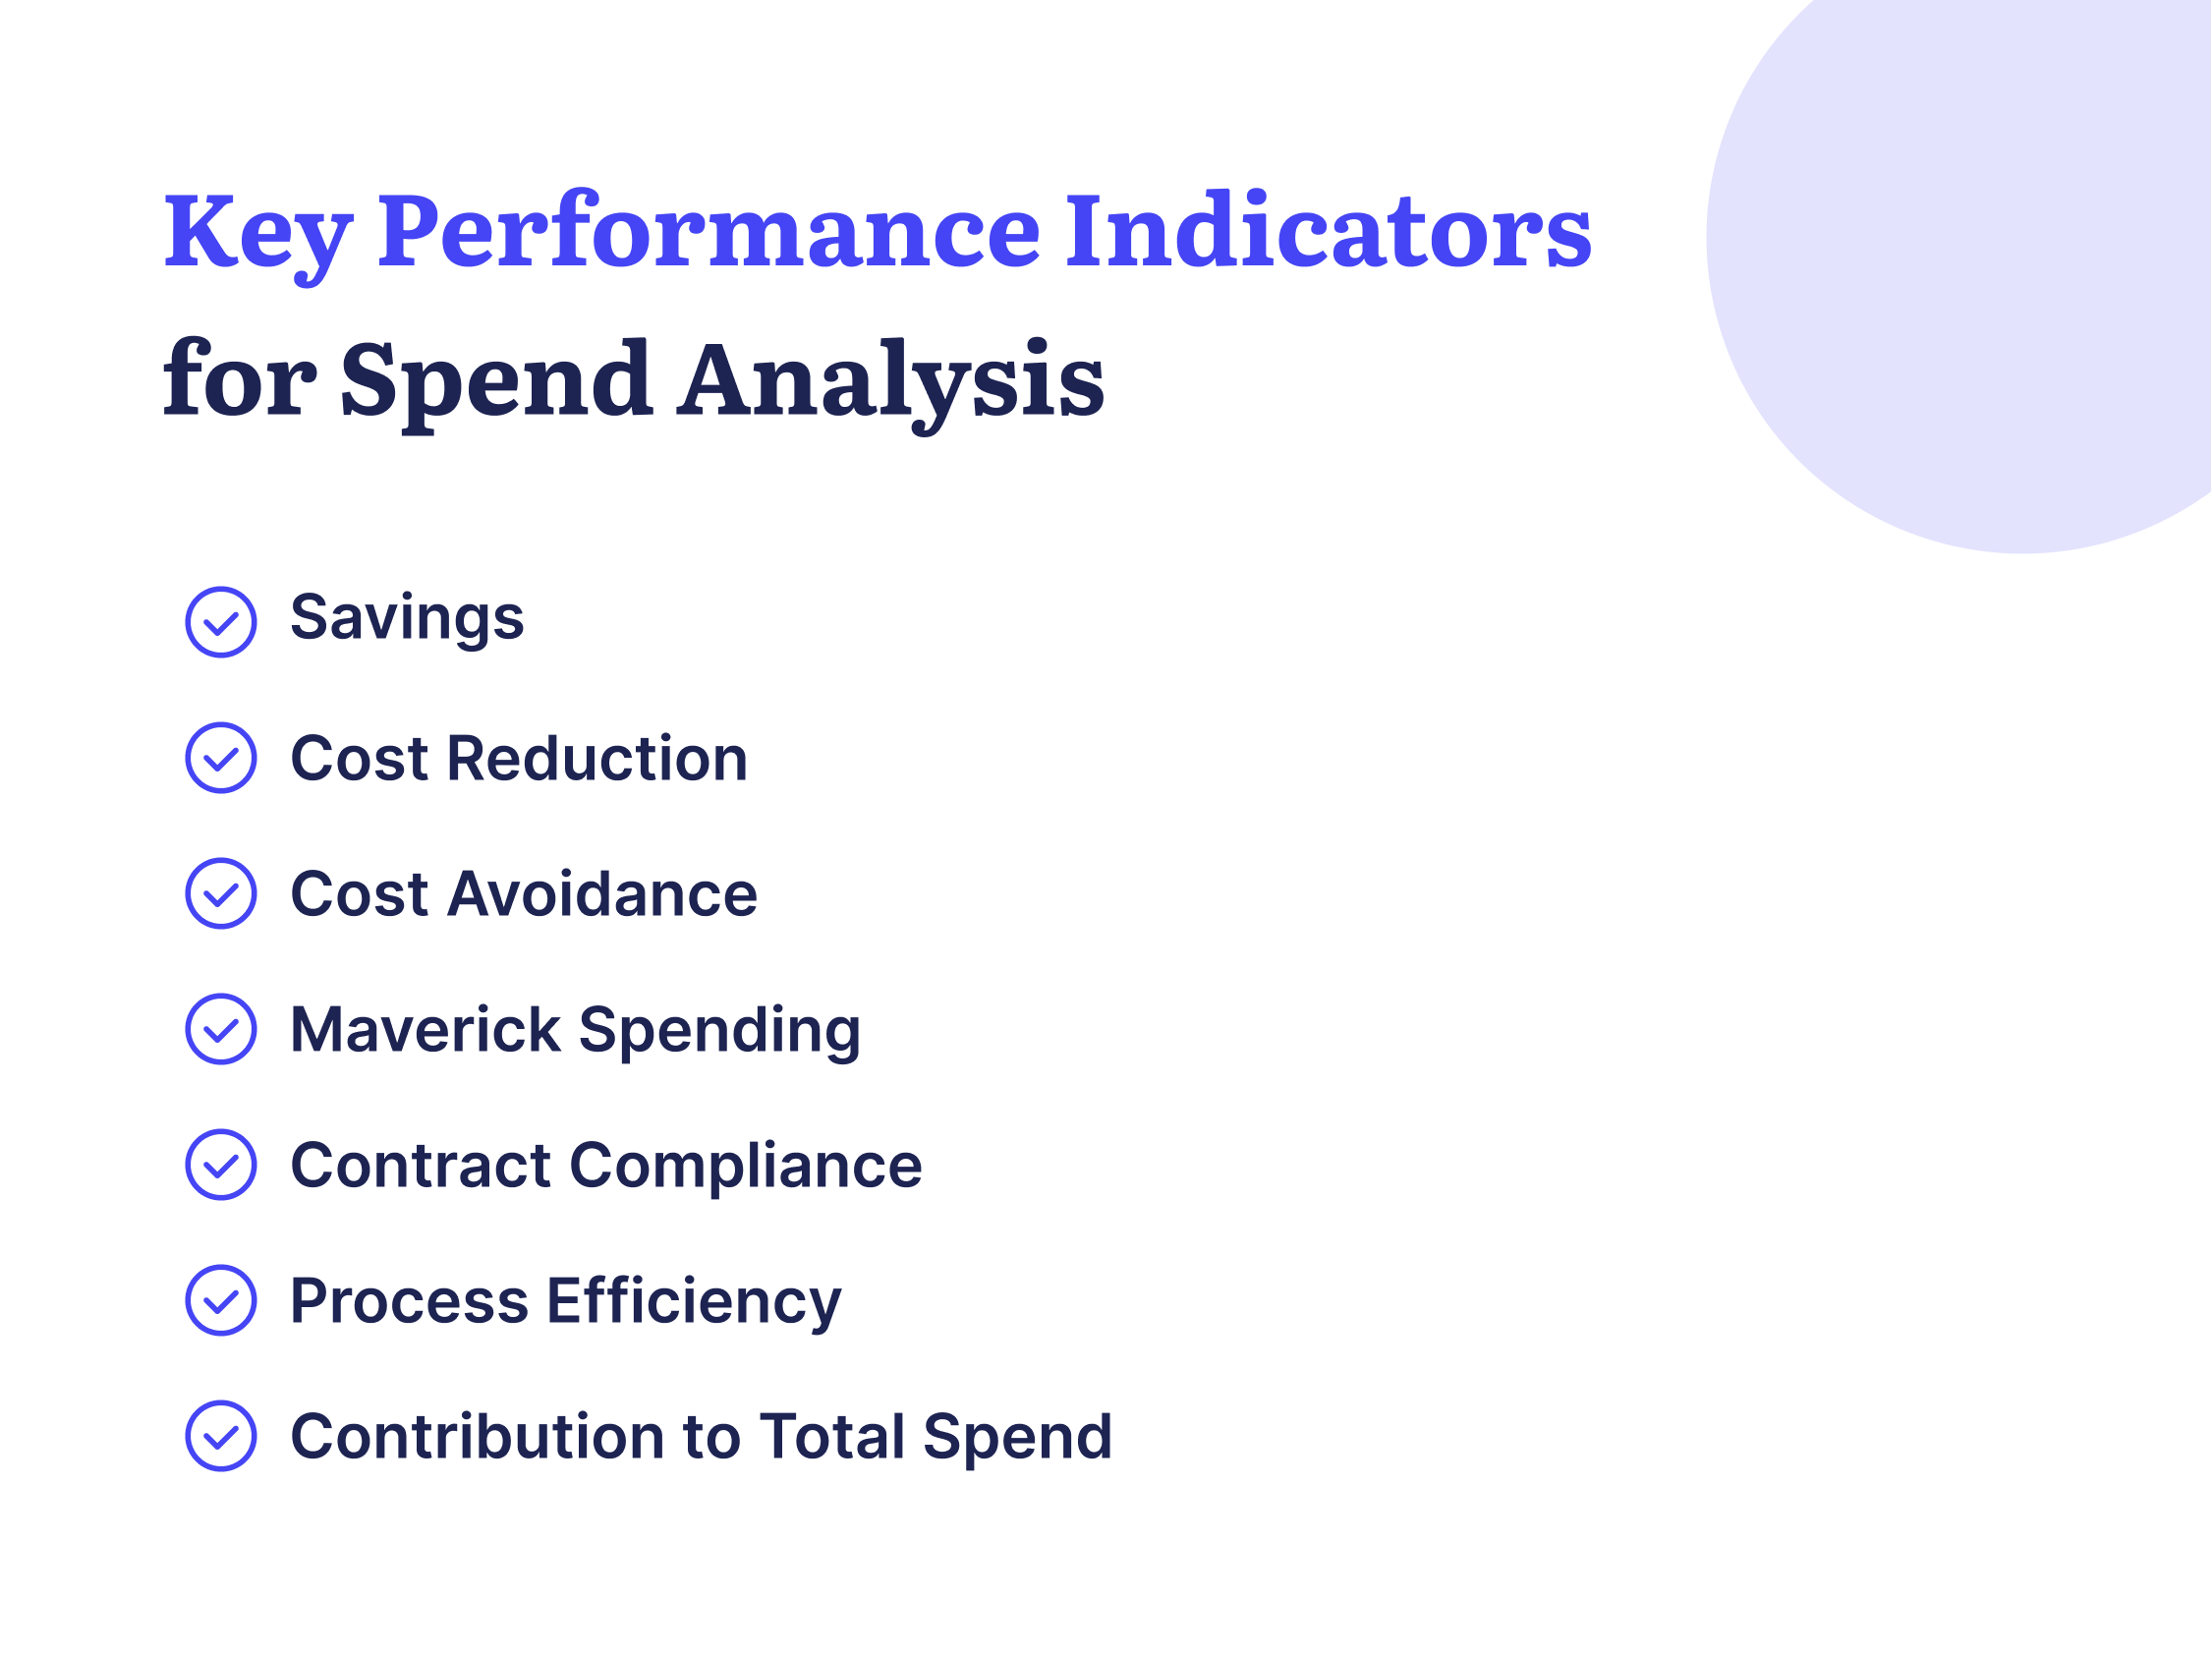
Savings
This KPI is relevant when a company decides to save by finding less expensive alternatives for purchases or identifying ways to lower the cost of items through discounts and other better payment terms without negatively impacting the business. The amount of money spent before cost-saving measures is compared to how much was spent after taking these measures.
Cost Reduction
Similar but slightly different, the cost reduction KPI applies to companies that choose to completely eliminate certain expenses, regardless of how it affects the quality of their own product. Spending between the pre- and post-elimination periods is compared so that companies see how effective cutting expenses was and decide how to proceed further.
Cost Avoidance
This KPI identifies the amount of money an organization will avoid spending thanks to current or ongoing measures such as proper tool maintenance, inventory management, and material tracking.
Maverick Spending
This is the number of purchases made without going through the proper approval workflow. It's expressed as a percent of total invoices that don't have a matching purchase order.
Contract Compliance
There's also a group of KPIs that assesses the performance of suppliers. There are a lot of KPIs that fall under this, but we'd recommend starting with the following:
- Supplier lead time, which is the average period between requested orders and their delivery
- Product/service defect rate, which measures how frequently goods are unusable or services unstable
- Order accuracy, which determines how often you receive the wrong order.
Process Efficiency
Process efficiency is often measured by looking at the requisition-to-order time, meaning the average period between submitting a requisition and creating the associated purchase order. The shorter this period, the more efficient the process. One of the best ways to achieve this efficiency is by implementing a PO system.
Contribution to Total Spend
This one demonstrates the number of funds taken up by each department and location and determines how much money a company spends on specific items, categories, or suppliers.
KPIs compare current and historical spending and business processes and demonstrate positive or negative dynamics over time. They are calculated from spending data once it's put together, cleansed, and classified. Usually, the numbers are stored as spreadsheet charts and may be visualized as graphs.
Using the right KPIs ensures that spend analysis demonstrates concrete, relevant numbers and estimations so that companies can see the exact results of their previous decisions and create a fact-based roadmap for the future.
Types of Spend Analysis
Now that we know what spend analysis is and which KPIs are important for it, let's consider the most popular approaches. Each type of spend analysis focuses on a different aspect of the procurement process. Depending on its objectives, a company may perform one or several types of spend analysis simultaneously.
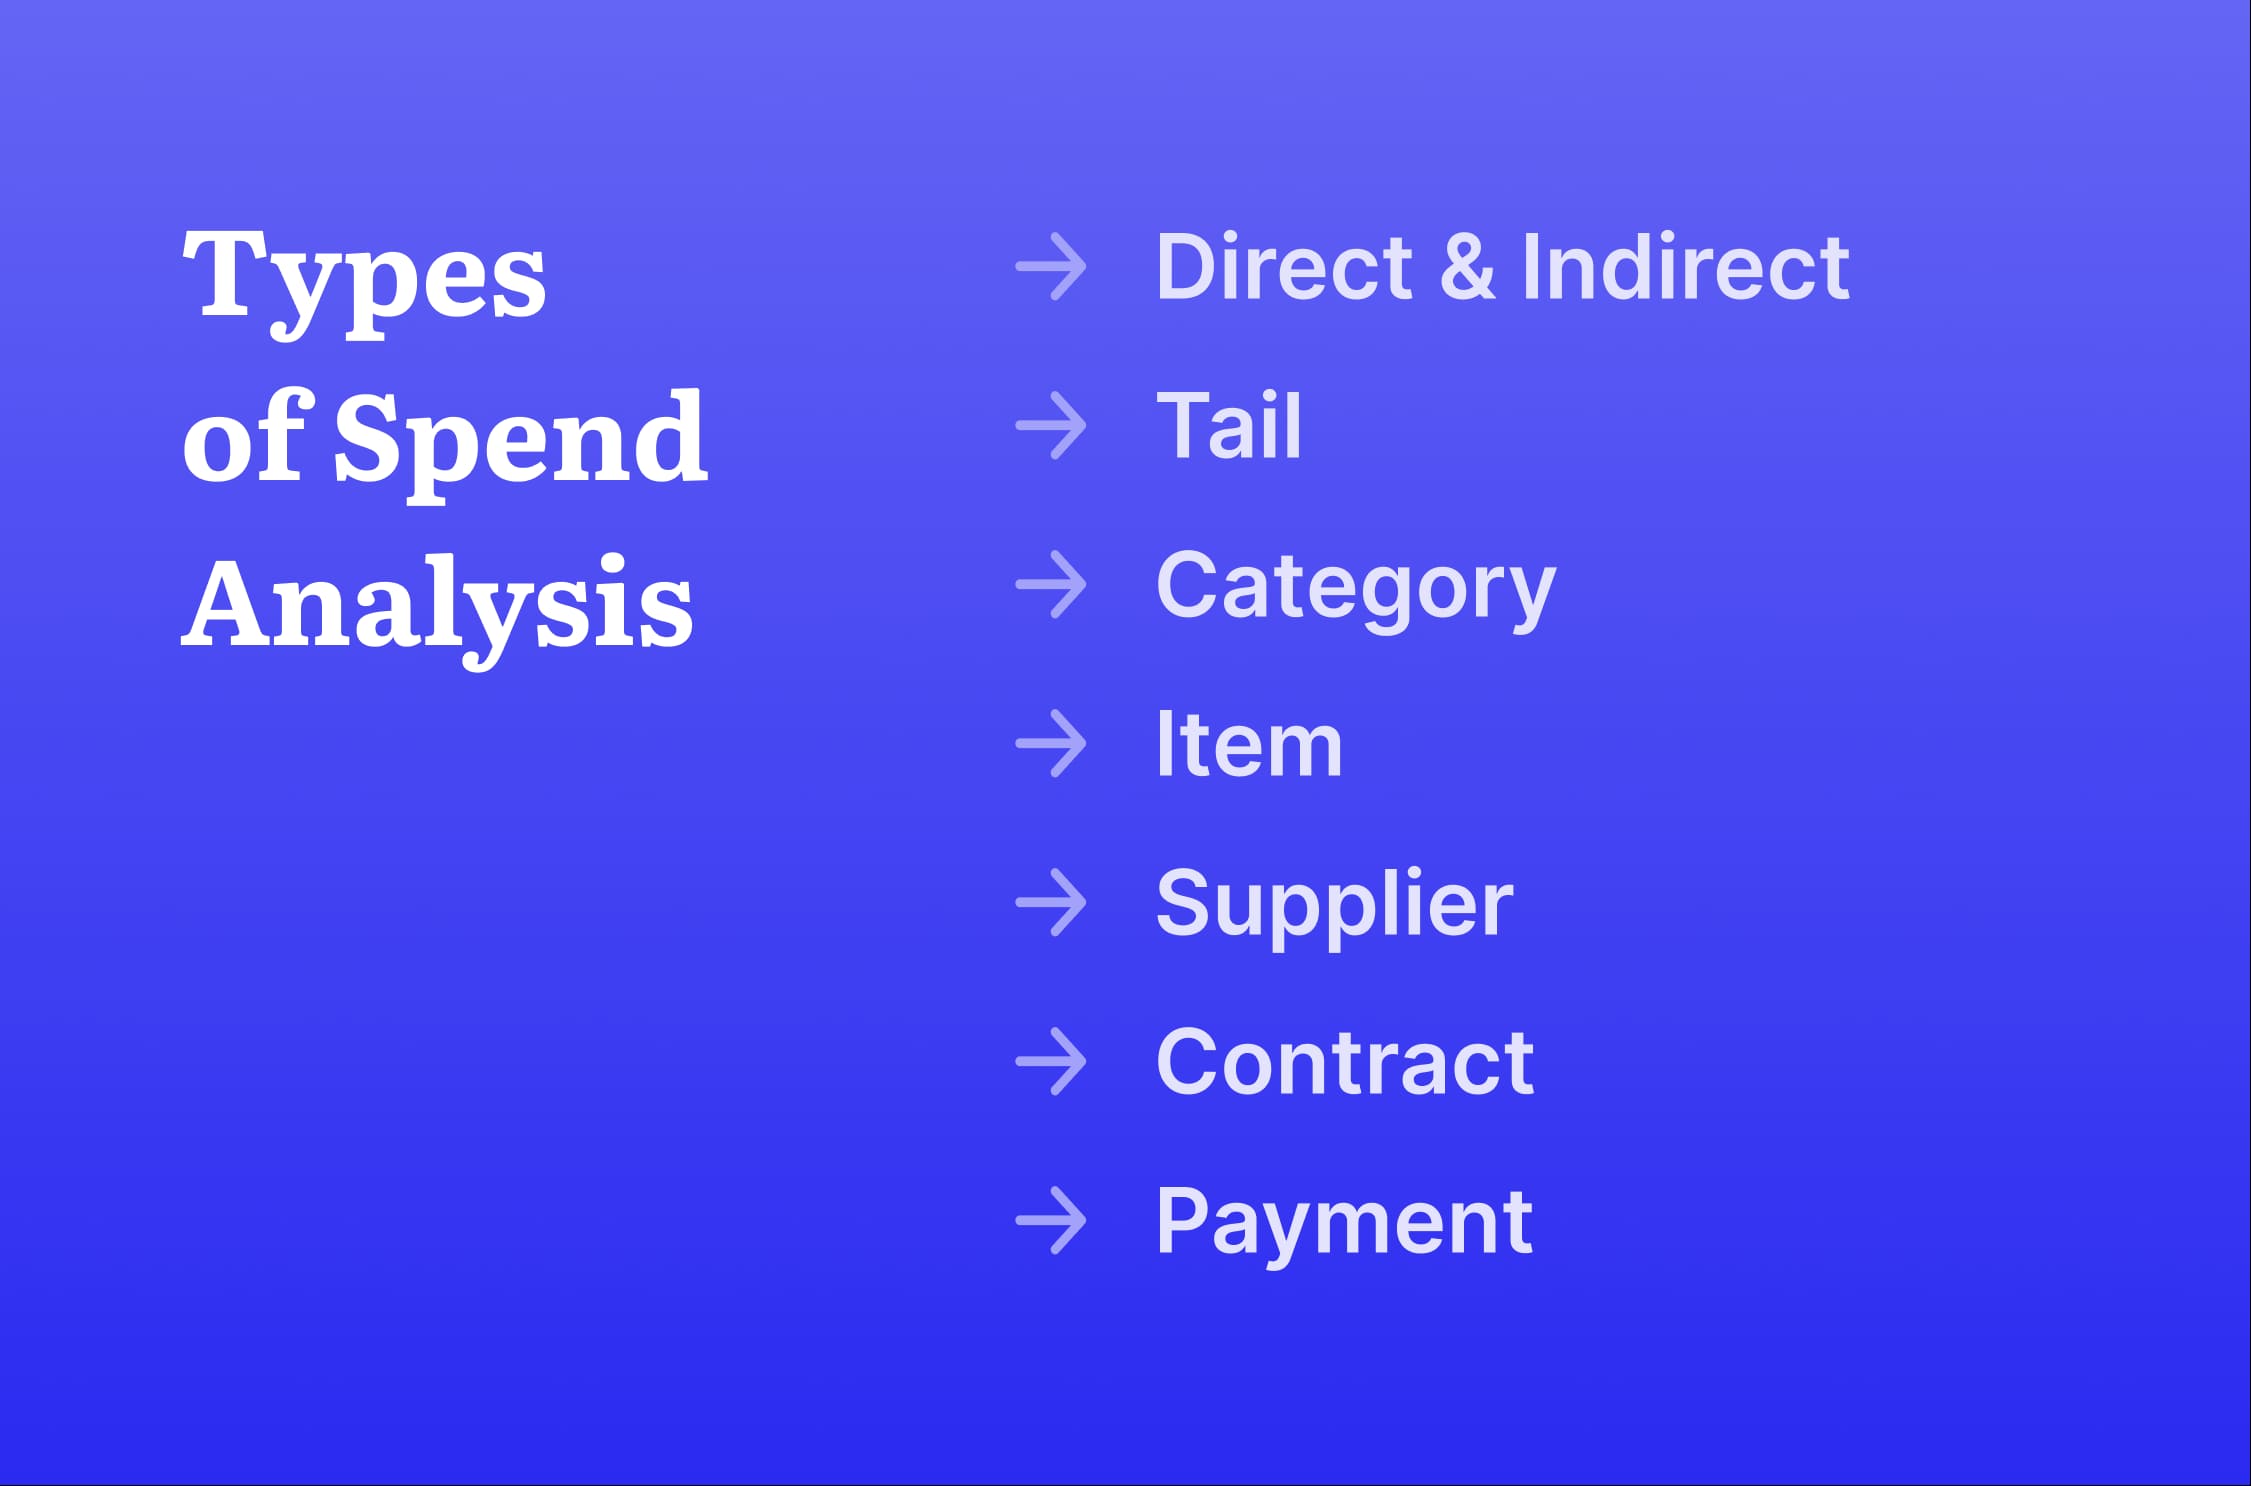
Direct & Indirect Spend Analysis
Companies may divide expenditure into two groups, direct and indirect, in order to examine how much budget is taken up by these types of purchases.
Direct spend encompasses all purchases that directly impact the manufacturing of the company's final product, such as raw materials, components, and equipment.
Indirect spend refers to purchases that support the business but are not directly related to creating the final product — office supplies, facilities, utilities, travel and transportation, outsourced and professional services, marketing and HR functions, and more.
Let's take a biotech company as an example. Direct expenses are microscopes, pipettes, scales, hot plates, incubators, fume hoods, and chemicals. On the other hand, electricity, software subscriptions, advertising, and consultancies are examples of indirect spend.
Spend analysis helps companies clearly differentiate between these two types and track the cash flow related to both.
Tail Spend Analysis
When small and uncontrolled purchases in a given period add up to 80% of transactions but only 20% of the monetary value of those transactions, it's referred to as tail spend. Examples of tail spend may be highly diverse, from instant coffee for the office to notebooks and uniforms.
Observing tail spend reveals disorganized purchases that lack proper control and strategic sourcing, meaning that they take up more money than necessary and involve unvetted suppliers.
By ignoring tail spend, organizations encourage maverick spending and miss out on cost savings. Instead, they should prioritize making small purchases a more efficient process. To do so, it's necessary to find reliable suppliers with favorable conditions of cooperation and transparently allocate money for such expenditures.
Category Spend Analysis
This analysis focuses on expenditures in different spend categories that logically group similar purchases as part of category management. It explores the categories of goods and services on which the business spends the most money.
In order to perform spend analysis, a company studies the scope of each spend category (administrative support, travel, professional services, IT, marketing, and so on). This process allows enterprises to prioritize and align specific categories with business needs.
Category spend analysis identifies spend leakage issues by showcasing whether different departments separately buy the same products or the same category of items is delivered by several suppliers. In addition, this type of analysis encourages better budget allocations.
Item Spend Analysis
Item spend analysis looks at what was spent on specific items, like computers, a software subscription, a particular manufacturing material, and so on. This process aims to reveal similar uncoordinated purchases of different teams or multiple suppliers for a specific item.
It also identifies unnecessary expenses that can be eliminated altogether. In order to properly conduct the analysis, it is necessary to match each item with its supplier and the department that ordered it.
Supplier Spend Analysis
Supplier spend analysis identifies how much a company buys from its preferred suppliers. Companies create a detailed spend profile for each supplier in order to identify and cut off low-value suppliers and consolidate purchases.
Contract Spend Analysis
Using contract spend analysis, companies can identify spend leakage as well as situations where suppliers are non-compliant. It involves studying contracts with each supplier and comparing their prices and terms analysis against industry benchmarks. This process will help to reveal preferred suppliers and negotiate better terms and lower costs.
Payment Spend Analysis
Payment spend analysis examines a company's purchase-to-pay processes and payment patterns to identify unrealized discounts from suppliers, eg., missed early invoice payments. It also reveals opportunities to negotiate better payment terms.
Now that we've learned the benefits, key performance indicators, and types of spend analysis, let's discover the specific steps you might want to take to perform the typical spend analysis and get the most value out of it.
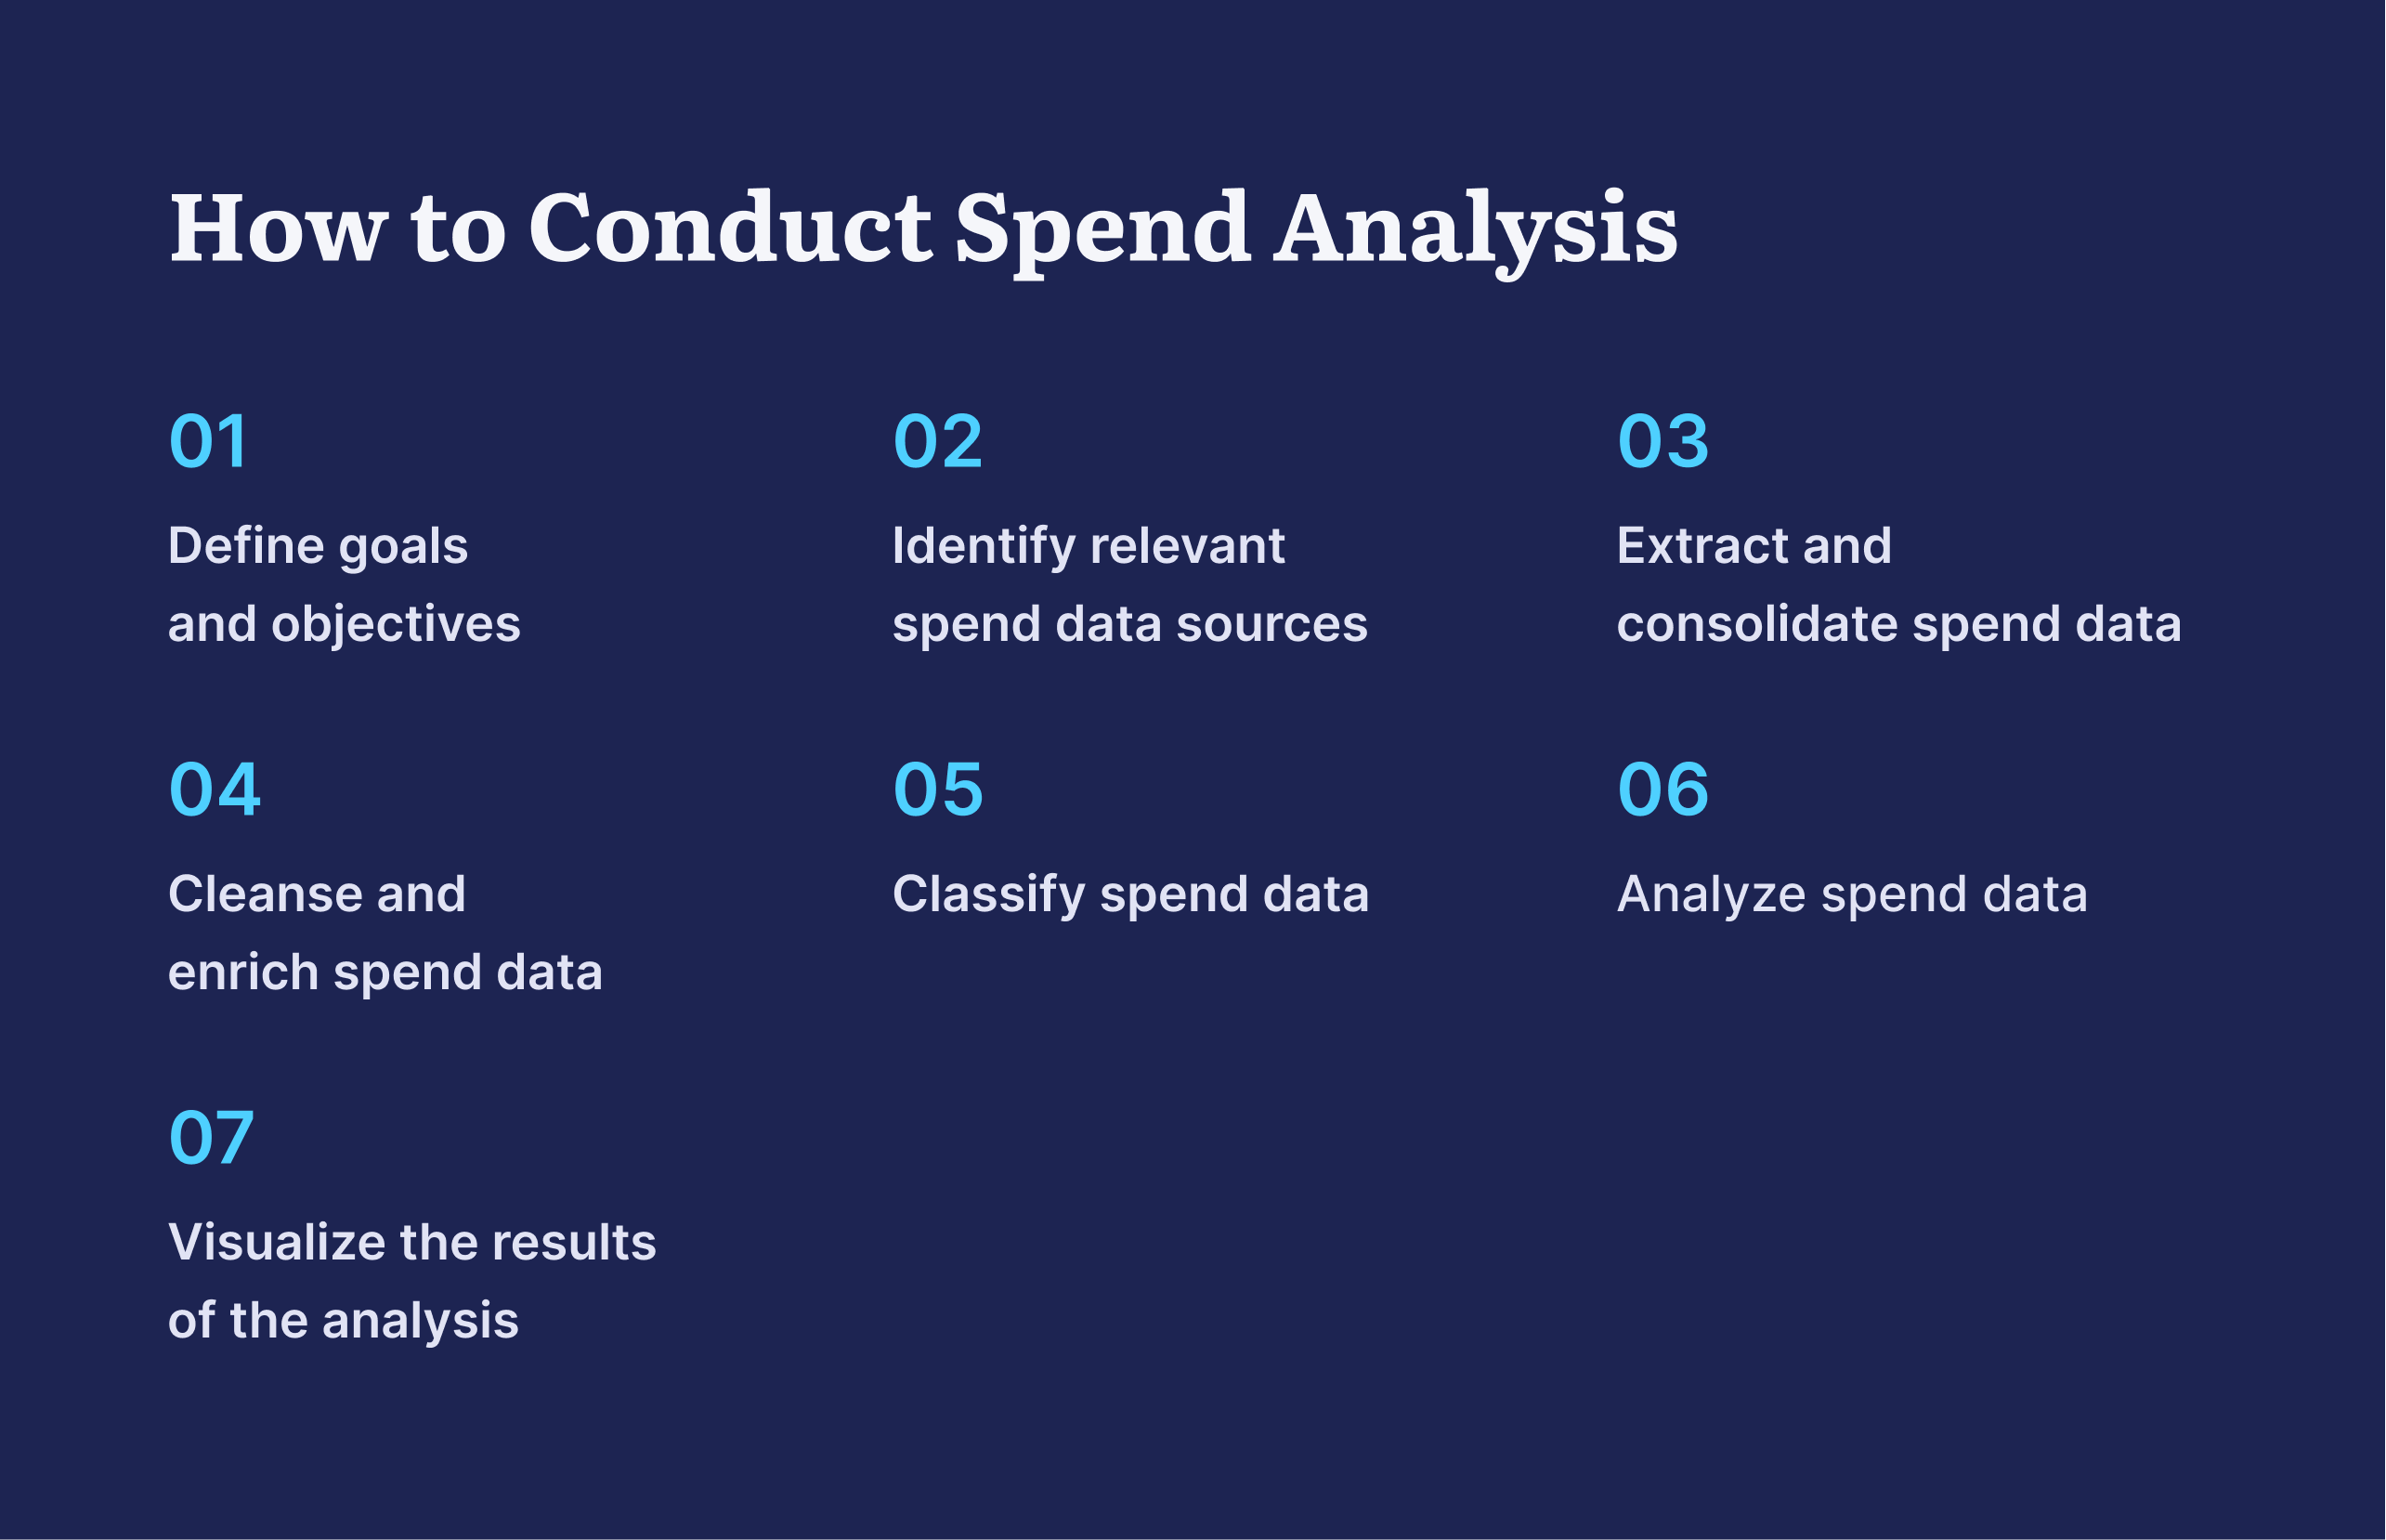
How to Conduct Spend Analysis
First of all, let's establish this: when you try to perform spend analysis for the first time, don't pressure yourself to rush and analyze too much and too quickly. Spend analysis has many steps and aspects, so start small and focus on one main goal.
Step 1. Define Goals and Objectives
Spend analysis starts before the analysis! Before collecting or studying any data, companies have to define their goals or questions they want to be answered. Then they identify which data and which types of spend analysis will help them reach these objectives and answer their questions. For instance, a company might want to identify cost-saving opportunities, pinpoint strategic suppliers, improve forecasting accuracy, optimize approval cycle times – or even all of the above.
Concrete objectives help to define what type (-s) of spend analysis a company should focus on. For example, if its primary goal is to examine the performance of current suppliers, an organization may choose supplier spend analysis and closely examine contracts, invoices, and receipts.
Organizations can also use KPIs to measure their progress; for example, if they hope to streamline internal procedures, they can look at process efficiency a KPI.
Step 2. Identify Relevant Spend Data Sources
In many companies, there is no centralized system for spend data, which is instead scattered across different business units, departments, and facilities. That's why it's necessary to identify where you can find the needed data.
Consider the following internal and external sources:
- Accounting system
- General ledger
- Bank and credit card data
- Excel spreadsheets
- Enterprise Resource Planning (ERP) software
- Payroll software
- Expense management system
- Procurement software
Step 3. Extract and Consolidate Spend Data
Once you know where your company's spend data lives, focus on consolidating it into one centralized system; this might be a manual spreadsheet or, ideally, a dedicated tool specifically for this purpose.
The spend database should contain your company's spending with vital information like departments that made orders, supplier names, and anything else you want to consider in your analysis. If you have paper documents, it's better to scan and digitize them to make it easier to find information later on.
Consolidating data is a complicated task, not just because of the massive amount of data that should be tracked and transferred but also because it may come in different formats. That's okay because the next step involves making it more legible.
Step 4. Cleanse and Enrich Spend Data
Spend data is made of various time zones, currencies, languages, and other formats. Although it may seem tedious, adjusting all data to one time zone, currency, etc., is necessary. Otherwise, you could end up with unclear conclusions.
Another discrepancy you may encounter is departments describing the same items differently or putting them into different categories. All this information should be standardized and entered in a unified manner across teams.
Supplier names should also be standardized throughout all documentation. Remember that company names may or may not change after mergers or acquisitions. Still, it's advisable to group subsidiaries of the same parent company to clearly understand how many suppliers you're dealing with.
Perhaps most importantly, review spend data for errors or inconsistencies; you may encounter redundancies, unreadable data, or missing fields with payments, categories, items, and contracts. Misinformation in documents can often be recovered by through other internal and external data sources.
Clean spend data helps to avoid mistakes and confusion in spend analysis results as it implies that all the information is checked and verified.
Step 5. Classify Spend Data
Once you've gathered and verified the data, classify it according to the categorization you'd like to choose (you may use the United Nations Standard Products and Services Code (UNSPSC), ECLASS, or create a custom-made hierarchy).
During this process, the goal is to connect each purchase to associated sources such as specific suppliers, departments, and projects and to group them based on these factors. This stage helps to break down vast amounts of spend data and understand how much money your company spends on specific groups of purchases.
If you want to focus on suppliers, you may also group them based on payment terms, spend category, purchase frequency, and other criteria important to your company.
Step 6. Analyze Spend Data
At last, it's time to measure the spending data against KPIs that were chosen after setting up company goals. The course of action here will differ depending on the analysis approach chosen during step one.
Let's imagine that your main goal is to proactively identify saving opportunities. The process for spend analysis would look something like this:
- Identify redundant subscriptions by examining services your company orders. Redundancy emerges because different teams may use the same platforms separately or implement new programs without properly canceling the old ones.
- Look for and group the same purchases across departments in order to create fewer POs and get volume discounts. The step above focuses on services; this one calls attention to goods.
- Identify maverick spending and find suppliers for each of the categories that fall into the group of uncontrolled purchases. For instance, food and drinks for the office might seem insignificant, but failing to conduct proper sourcing for even minor purchases might add up to uncontrolled expenditures.
- Review contracts and search for better sourcing opportunities if supplier performance is far from great and you want better pricing, especially for high-dollar purchase orders.
When the spending data has been analyzed, it's finally time for the last step.
Step 7. Visualize the Results of the Analysis
Data has no use if you can't read it, right? Data should be presented in a clear and concise way. Individuals working on spend analysis can compile their findings into reports, or it may be done automatically by the program they use. Well-visualized data can be revisited easily, saving employees and stakeholders time and effort.
Spend data reports come in many forms, including but not limited to dashboards, Excel reports, documents, or shareable presentations with tables, charts, graphs, and images. To facilitate sharing and ensure consistent formatting, converting Word files to PDF can be beneficial.
The report should display all critical aspects of spend analysis individually, so your teams can clearly understand current business processes and suggested improvements.
Congratulations! If you followed all the steps, you successfully conducted a spend analysis and most likely gained actionable insights to help save costs and optimize the procurement process.
But please remember that repetition is critical to tracking progress and monitoring the implementation of any changes. Spend analysis should be performed at regular intervals as defined by your organization.
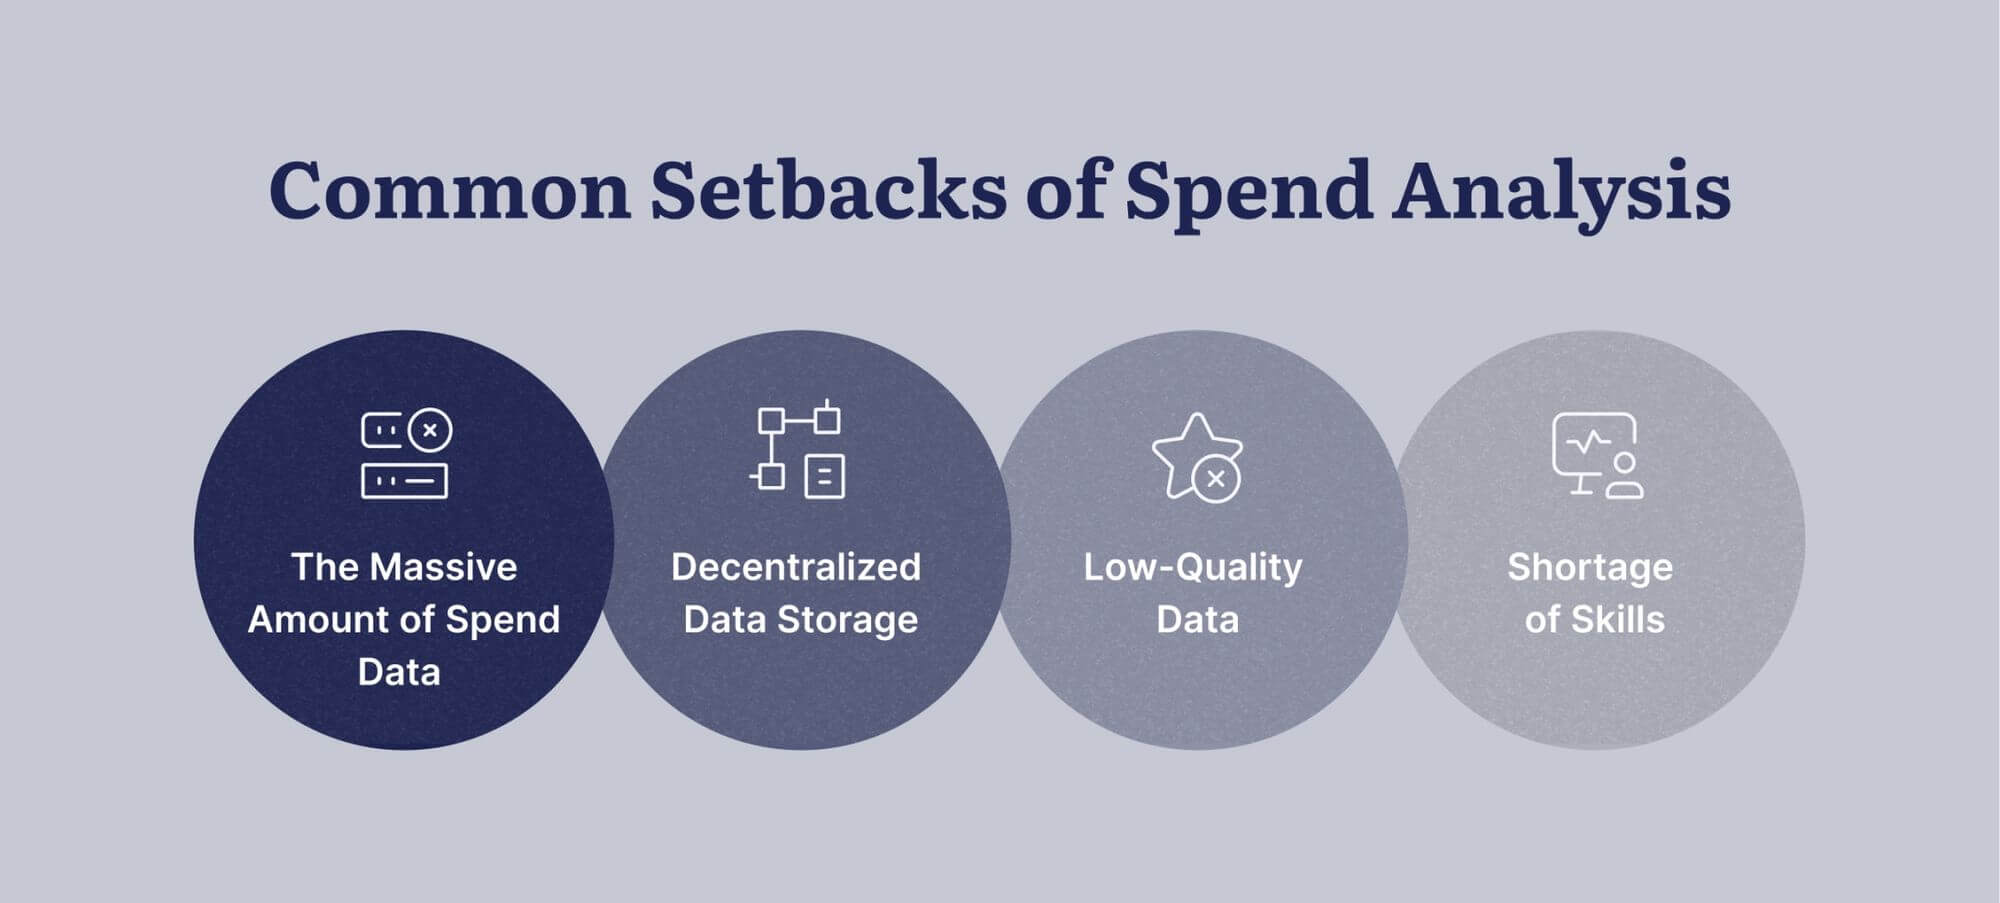
Beware of Common Setbacks of Spend Analysis
Spend analysis is a complicated process that requires the utmost attention and dedication of the parties carrying it out.
Unfortunately, this means that companies might be discouraged from adopting this fruitful practice. Let's consider some common pitfalls of spend analysis.
The Massive Amount of Spend Data
The amount of data connected to each transaction and interaction is overwhelming, especially for fast-growing companies. It leaves procurement professionals with bazillions of interconnected data sets that must be sorted out and processed before they can be used.
Decentralized Data Storage
Without an established procurement process, extracting, consolidating, cleansing, and categorizing spend data is incredibly labor-intensive and nerve-racking.
It's tedious and time-consuming to search for vital information for spend analysis when there's no centralized approach to creating and storing procurement documents or when there is no supplier/item catalog.
If all of a company's spend data is sprinkled throughout various departments and facilities in the form of paper documents and digital databases, collecting and cleansing it of all the missing points and errors will waste time as well as human and financial resources.
Low-Quality Data
Poor data quality results from a decentralized and uncoordinated approach to filing procurement-related documents.
For example, when an employee changes information about a supplier in one system, it may not be automatically updated in other systems used. This leads to confusion and discrepancies among different departments within the company.
Human errors during manual data entry can also damage the quality of spend information. Common examples of mistakes may include empty data fields or wrong spellings.
Shortage of Skills
Due to the complexity of the spend analysis process, the individuals carrying it out need a particular set of skills to tackle its multiple challenges.
First and foremost, employees involved in the spend analysis process should have the basic analytical and communication skills to carry out the following:
- look for and extract maximum information from various sources;
- investigate incidents where crucial details are missing, or discrepancies between data of different teams arise;
- classify purchases based on departments, projects, suppliers, spend categories;
- choose relevant KPIs, assess the company's processes using them, and more.
Hiring risk managers, training members of procurement teams, and automating the process where possible can fill any knowledge and skill gaps.
The Secret to Successful Spend Analysis
To keep spend analysis as simple – and accurate – as possible, consider automating the key steps of this process. With specialized procurement software like Precoro, you can eliminate the usual roadblocks in complex spend analysis, benefiting from unified data storage and a customized, centralized approach to the entire procurement process. Let's go into more detail about the benefits:
- Get a complete, centralized, and cloud-based data storage and management that can be accessed anytime and anywhere.
- Integrate your data from different financial systems (QuickBooks, Xero, and Netsuite) and ensure that changes in one system are automatically reflected in others.
- Automate and speed up the creation of purchase orders, invoices, and receipts, and build approval workflows.
- Get notifications about discrepancies, errors, and mismatches in purchase documents early on with discrepancy tracking.
- Create item and supplier catalogs.
- Set up budgets for different departments.
- Eliminate missing data by setting up mandatory or drop-down fields in the documents, leaving little room for human error.
- Gain access to customizable reports with automatically generated graphs and pie charts to see your company's spending patterns.
With these features, a centralized procurement system will significantly accelerate the whole spend analysis process and enable you to stay regular. Plus, you'll have up-to-date information any time you need it.
If you want to test out spend analysis software for yourself, you can book a demo of Precoro to learn more about optimizing spend data management.
Frequently Asked Questions
To Sum Up
Spend analysis is the process of analyzing expenditure data and procurement processes to find ways to save money, set up realistic budgets, enhance forecasting accuracy, identify underperforming suppliers, improve contract terms, outline weaknesses of internal procedures, and more.
The practice of spend analysis is crucial for efficient spend management and it's especially relevant for growing companies. An increasing amount of suppliers, workers, and procurement processes generate more uncontrolled expenses and decentralized document management.
Spend analysis sheds light on current and historical spending, savings opportunities, internal procedures, and contract management. It's the basis for well-informed decision-making and complete transparency.
Some pitfalls may discourage companies from performing spend analysis, such as the vast amount of spend data that must be worked with, decentralized data storage, poor quality of information, and lack of appropriate specialists.
Spend analysis software is invaluable for companies seeking to overcome these challenges. An ideal solution will increase the visibility of the cash flow, provide reliable and centralized data storage, speed up the creation of documents, ensure standard formatting, and can even generate custom reports.
Take full control over budgets so that money goes towards growing the organization, not to non-preferred suppliers or decentralized purchasing.
Want to see Precoro in action?


