18 min read
How to Use Procurement Reporting and Dashboards to Make Data Actionable
Wondering what procurement data to analyze and how to do it right? Here’s everything you need to know about procurement reporting and dashboards.
Let’s be honest: managing procurement can feel like a juggling act — with pending requisitions, undelivered purchase orders, unpaid invoices, budget tracking, and stock transfers all in the mix. That’s where procurement reporting dashboards come in and let procurement managers see what’s really going on. Procurement reports help companies track spending, monitor procurement documents, check how their suppliers perform, and make smarter, faster decisions to save money and stay compliant.
In this article, we’ll explain why procurement reporting and purchasing dashboards matter, highlight key reports to track, discuss common challenges, and outline the best approach to align procurement reports with your company’s goals.
Why procurement reporting matters
Simply put, procurement reporting is the process of gathering, organizing, and analyzing data from your sourcing and purchasing activities. It’s a perfect way to keep track of everything related to what you’re buying — how much you're spending, supplier efficiency, or procurement document statuses.
Procurement reporting can take various forms tailored to the needs of the organization and the audience it serves. The most common formats are tables, spreadsheets, and text-based documents with embedded graphs and charts. If you’re curious to know what a procurement dashboard is, stay tuned. Procurement dashboard is a concept closely tied to procurement reporting, but it offers a more dynamic, visual approach.
What is a procurement dashboard?
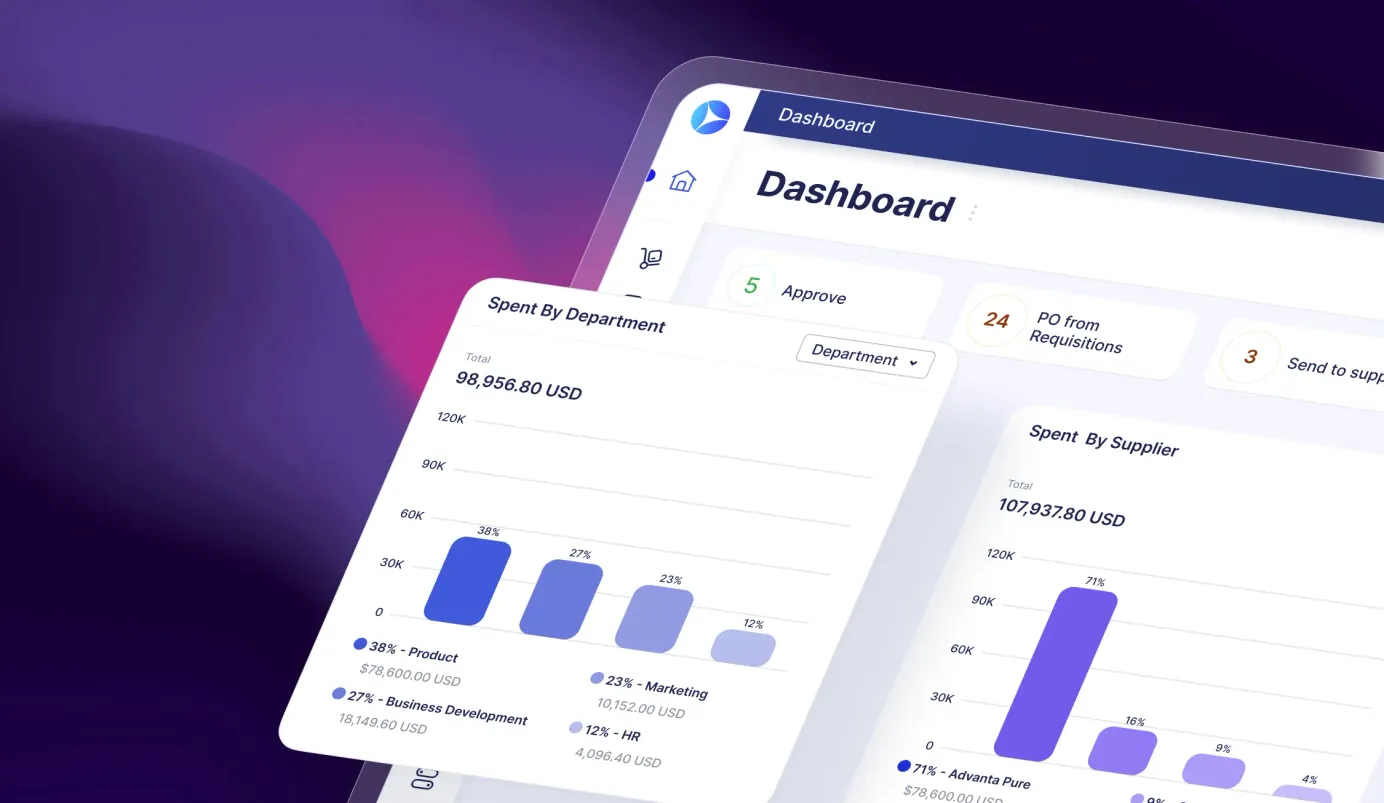
A procurement dashboard is a visual tool that aggregates key procurement data, from budget availability to order statuses, in one place and displays it in easy-to-understand charts and graphs. Think of it as your go-to dashboard for tracking everything that’s happening in procurement but with much less effort than sifting through endless spreadsheets or emails.
There are various tools available for managing procurement data, from Power BI procurement dashboards that provide customizable analytics and visualizations to built-in procurement reporting dashboards offered by purchasing software. Procurement dashboards are designed to provide real-time insights and enable ongoing monitoring.
On the other hand, procurement reports are more detailed, structured documents that typically summarize data over a specific period. They are often used for analysis and long-term planning. With both reports and dashboards, procurement teams get a holistic, clear picture of how efficient their processes are and where they can improve.
Wondering what a procurement dashboard is in practice? Here are some examples:
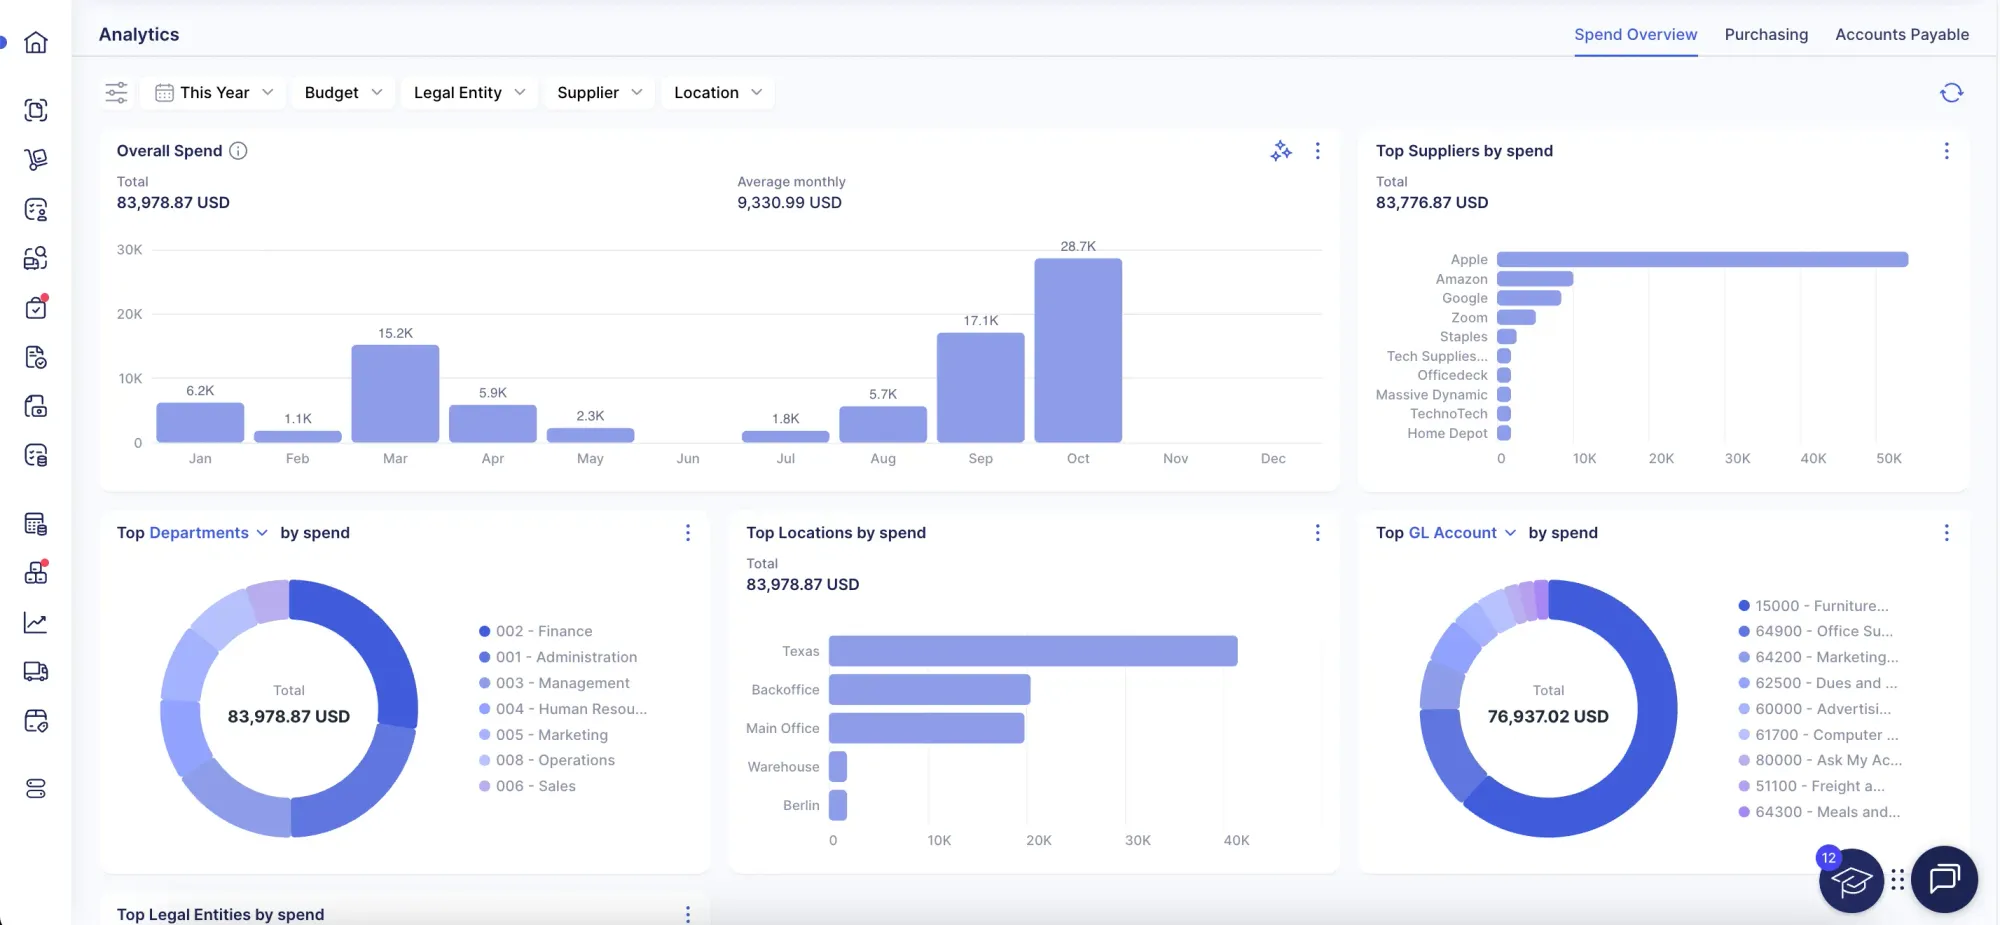
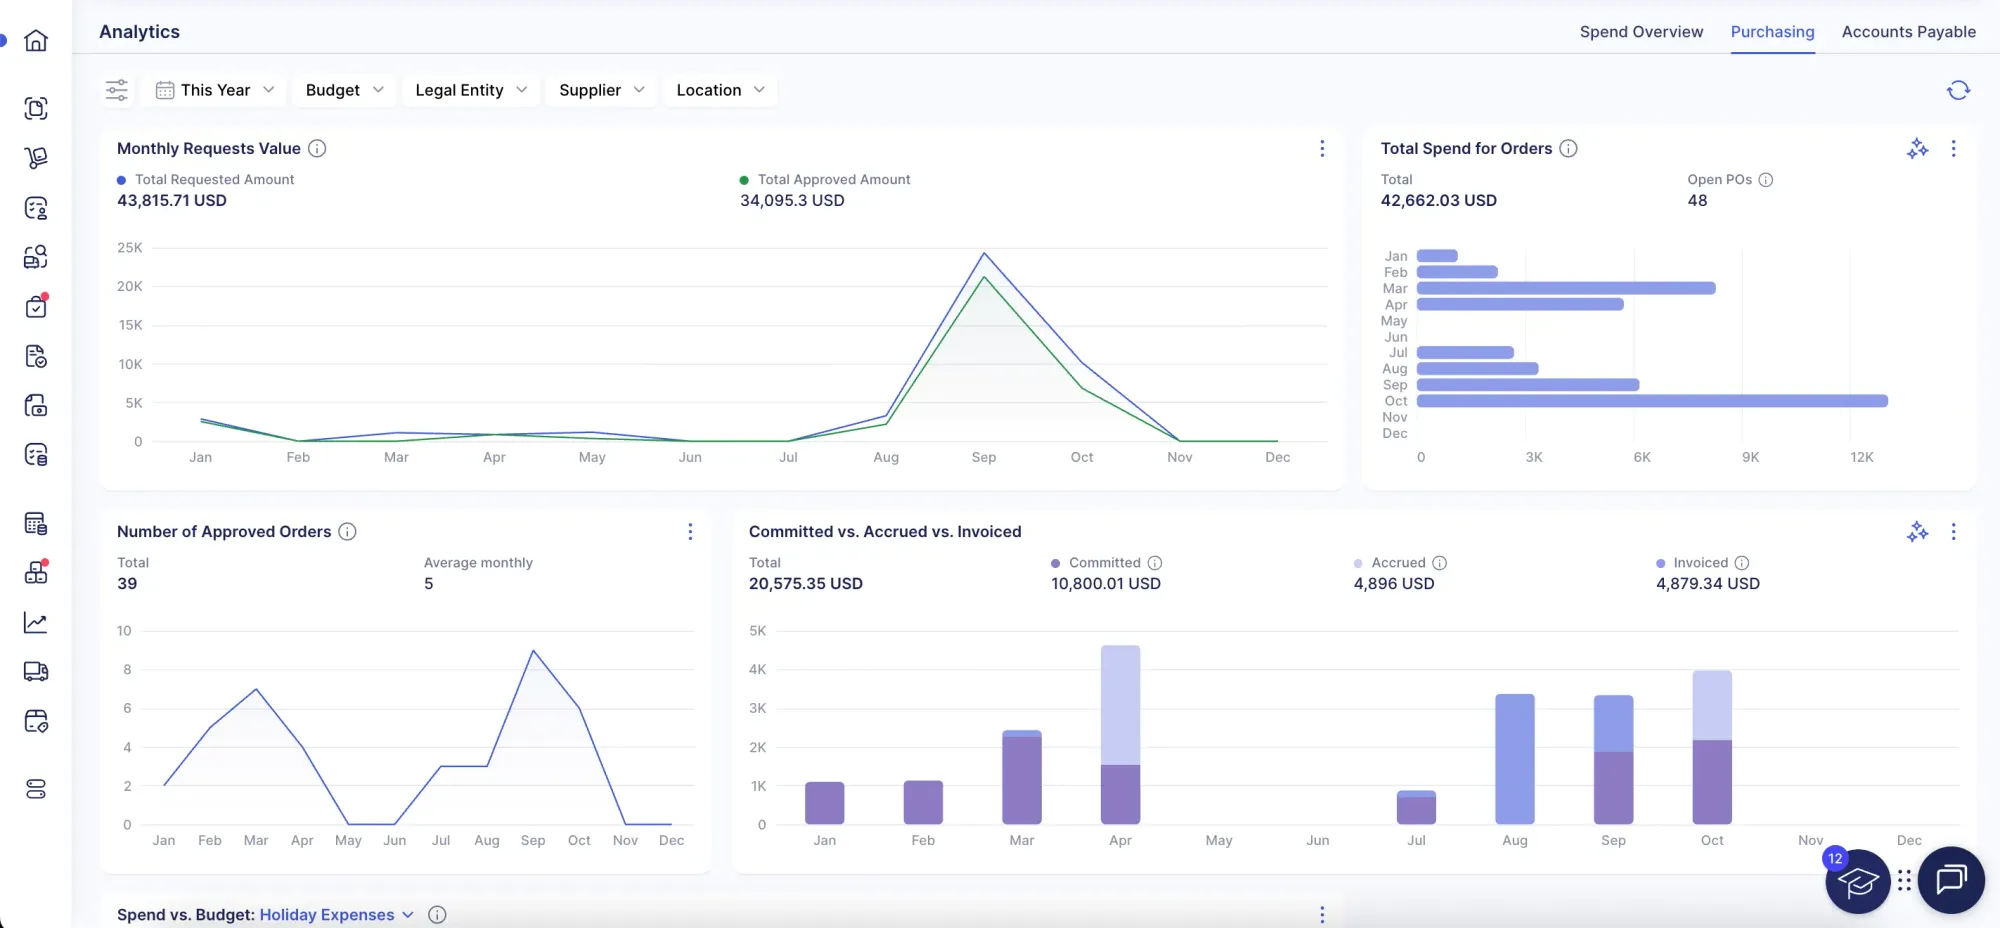
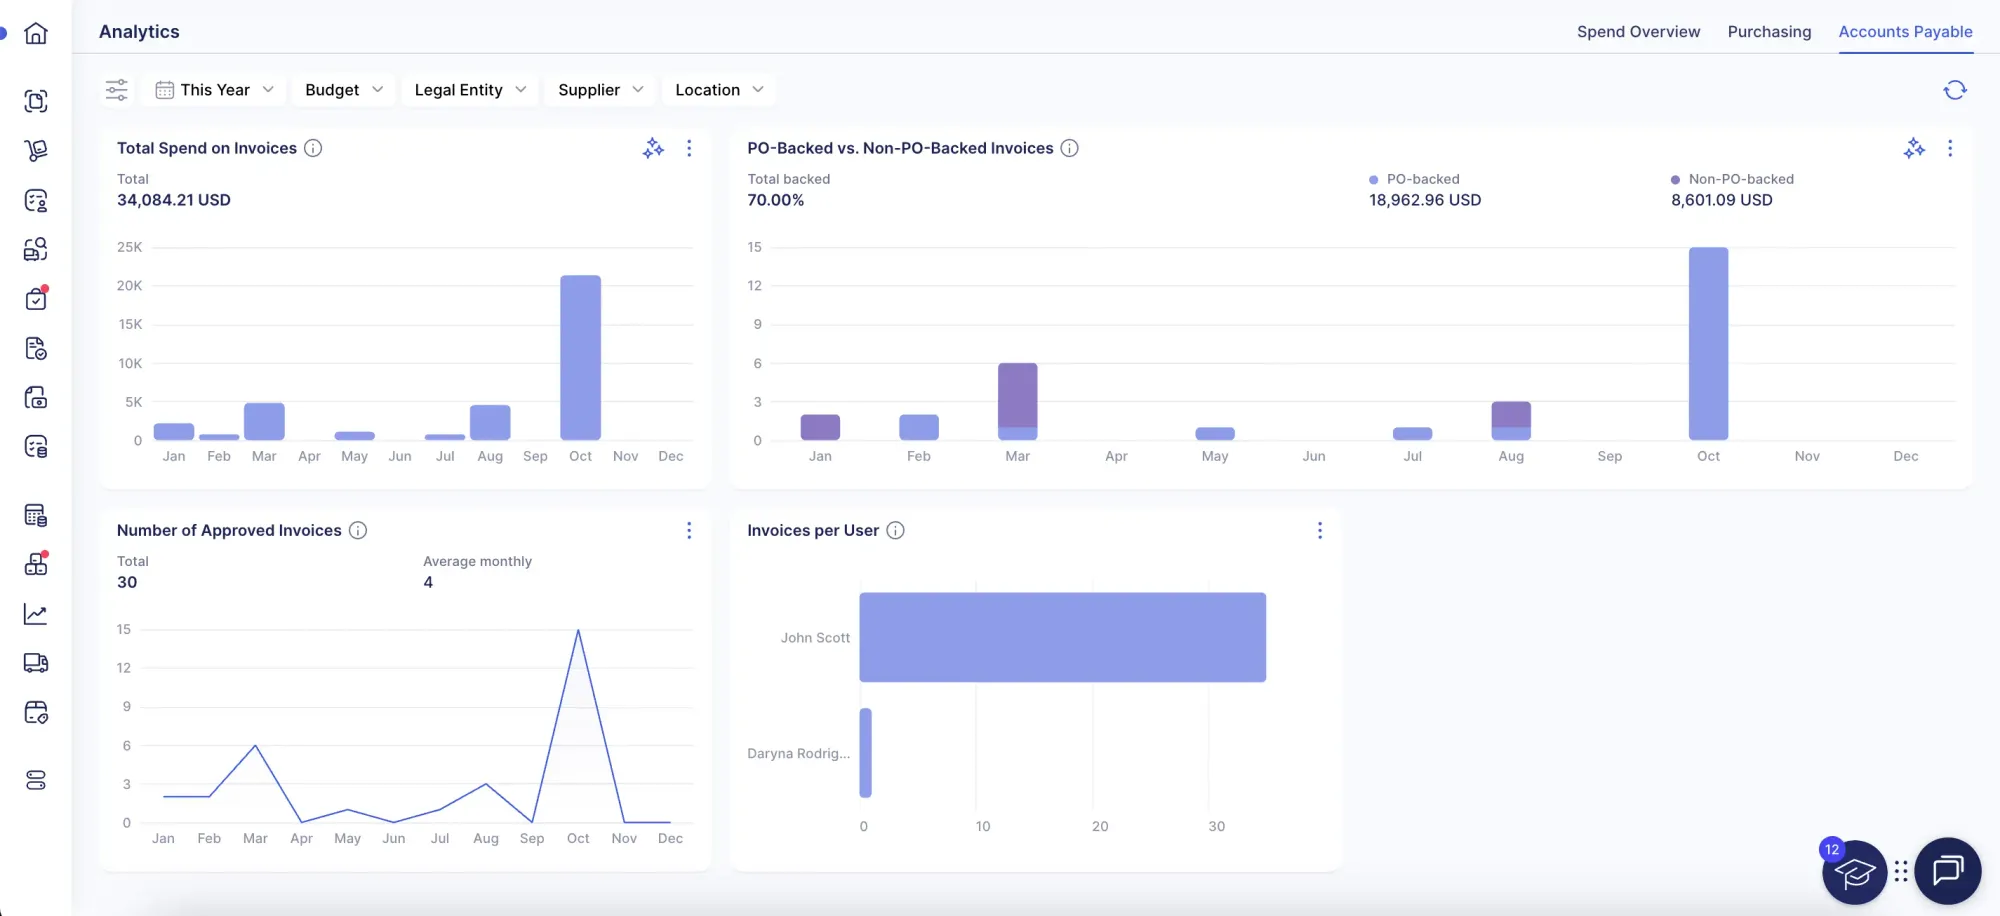
Precoro's advanced dashboards go beyond static reporting: they offer interactive visualizations, real-time updates, and role-based customization. Users can filter data by suppliers, departments, projects, or timeframes, which allows them to focus on the most relevant metrics for each role—from CFOs to AP managers and procurement teams.
You can learn more about Precoro's new dashboards in this article.
Benefits of procurement reporting and purchasing dashboards
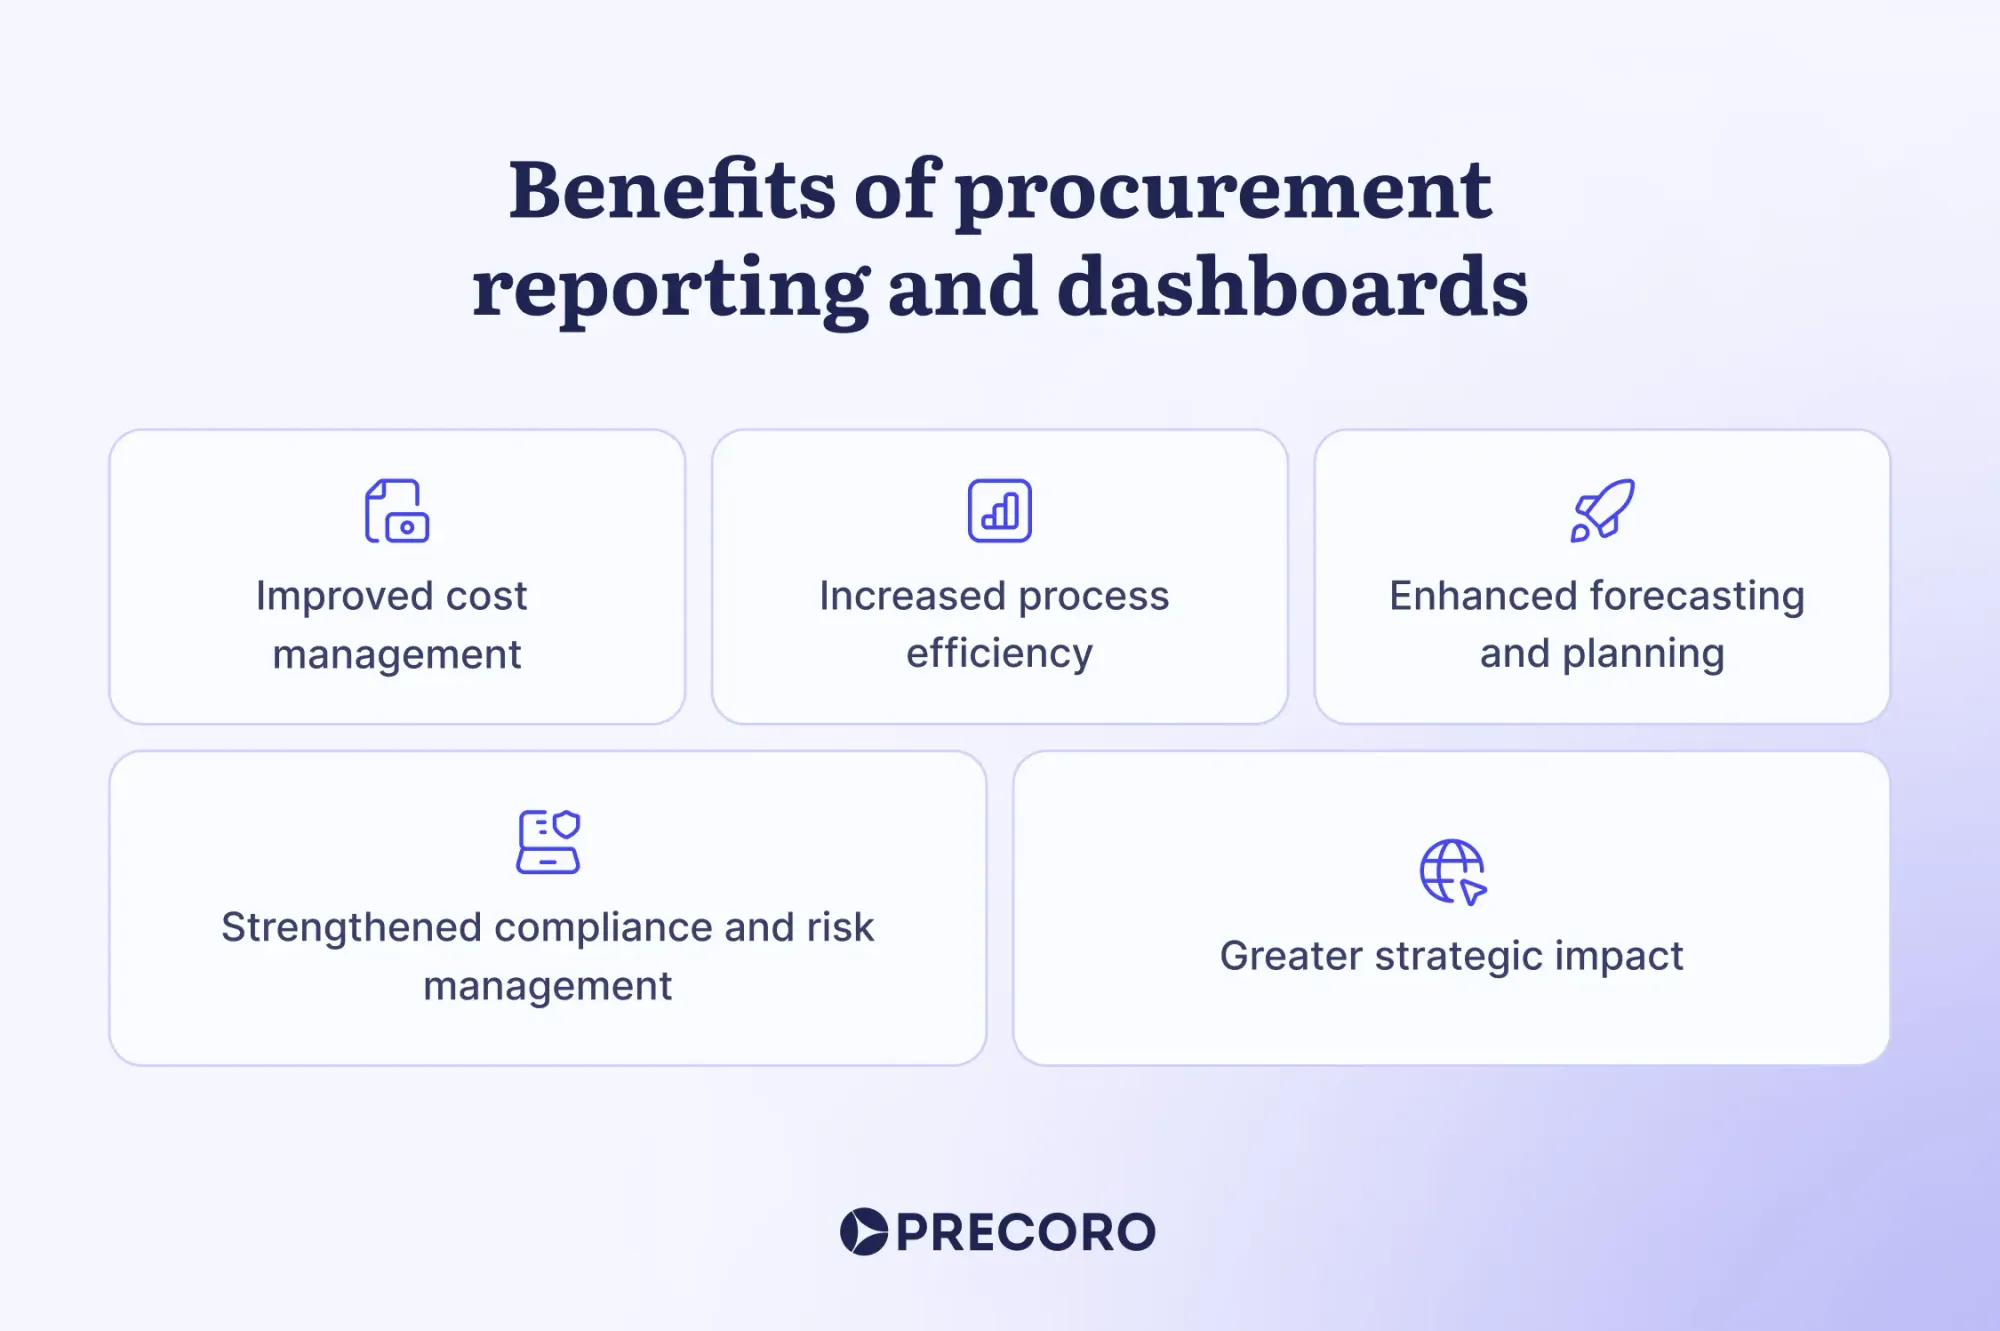
Now that we have explained what a procurement dashboard is and how it differs from procurement reports, it’s clear how they complement each other to give you full visibility into purchasing activities. Together, they offer a range of benefits that extend well beyond simply keeping track of direct and indirect purchases.
Improved cost management
One of the most immediate benefits of procurement reporting dashboards is the ability to manage costs better. By analyzing spending patterns, organizations can identify exactly how money is spent and assess whether those expenditures are justified. Data can highlight key issues, including:
- Overlapping contracts where multiple suppliers with different prices deliver similar goods or services.
- Purchases outside of established supplier agreements, for instance from non-preferred vendors, that often result in higher costs.
- Unnecessary spending on low-value items, tail spend, or double orders.
These insights provide invaluable guidance for fixing the issues. For example, by grouping low-value orders together, businesses can take advantage of bulk discounts and avoid unnecessary purchases.
Similarly, procurement professionals can negotiate a master contract with a preferred vendor for frequently used goods or services and cover all departments, therefore eliminating the need for separate contracts and streamlining procurement. With the help of a procurement savings dashboard, businesses can track how much money has been saved thanks to these measures.
Increased process efficiency
Procurement reports play a critical role in identifying inefficiencies or bottlenecks within the procurement process — whether it’s a slow approval process, a delay in order fulfillment, or late payments. Such insights allow procurement teams to address these concerns directly.
For example, if the report reveals that purchase orders are often delayed at the approval stage, implementing an automated approval system can speed things up. Similarly, if supplier delays occur, helpful strategies might include renegotiating contracts for stricter delivery timelines, implementing performance-based penalties, or diversifying the supplier base.
Enhanced forecasting and planning
Procurement reports provide businesses with a rich pool of historical data that is essential for making informed decisions about the future. By analyzing past purchasing trends, companies can gain valuable insights into demand patterns, seasonal fluctuations, and supplier performance. This data allows businesses to better anticipate what products or services they will need to procure in the coming months.
With improved forecasting, procurement teams can also better predict price changes, whether due to market fluctuations, raw material shortages, or other factors. For example, let’s suppose historical reports show that prices for a particular material tend to rise during certain seasons. In that case, the team can proactively secure supplies at a lower price before the increase hits and then check whether it pays off on a procurement savings dashboard.
Strengthened compliance and risk management
Procurement reports help businesses ensure that purchasing activities align with company policies, industry regulations, and legal requirements. Procurement dashboards showcase whether a company sticks to approved budgets, verifies invoices before issuing payments, and avoids risky spending behaviors.
In addition, procurement teams can use procurement analytics dashboards to track contract adherence, verify that orders match the agreed-upon terms, and ensure that suppliers meet regulatory standards. This visibility minimizes the risk of engaging with unreliable or non-compliant vendors, which can otherwise lead to costly legal issues or supply chain disruptions.
Regularly generated procurement reports also provide a reliable audit trail of all procurement operations and transactions. This traceability promotes confidence among stakeholders, including executives, auditors, and regulators.
In addition to helping companies meet legal and regulatory requirements, procurement reporting dashboards foster a culture of accountability and integrity within the organization. When employees and teams know that their actions are being monitored and assessed against clear policies, they are more likely to adhere to those guidelines.
Greater strategic impact
Effective procurement reporting elevates procurement from a routine back-office task to a key strategic function within an organization. By delivering real-time data, procurement savings dashboards empower procurement managers to align their activities with broader business objectives.
Instead of just tracking purchases, managers steer strategies that support the company’s success. This shift is backed by the 2024 Economist Impact survey, which highlights the expanding role of procurement within organizations and a growing perception of this function as a value generator.
For example, procurement reports provide valuable insights for renegotiating supplier contracts with better terms, diversifying supplier portfolios to mitigate risks, and uncovering cost-saving opportunities across the supply chain. With this data-driven approach, procurement teams support long-term business growth and help all departments and entities operate efficiently.
Key procurement reports
Procurement reports can be categorized based on the specific focus or role they fulfill within the procurement process. Here’s a rundown of the most common and useful types of reports you can create:
Spend reports
These reports provide an overview of where, how, and why money is going. Procurement managers use procurement savings dashboards to analyze expenditures across departments, suppliers, and categories, which helps identify inefficient patterns, areas of overspending, and opportunities for cost reduction. When prepared manually, spend reports are built by collecting data from purchase orders, invoices, and payment records and grouping this data by specific criteria (for example, a supplier or a department) aligned with the report goal. For instance, a ”Departmental Spend Report” provides insights into how much each department within the organization is spending.
Supplier reports
Focused on supplier performance and relationships, these reports track metrics like delivery times, quality of goods, pricing consistency, and contract compliance. They help assess the reliability of suppliers and identify which ones offer the best value. For example, a “Supplier On-Time Delivery Rate Report” tracks how often suppliers meet agreed delivery timelines. To create it, procurement managers need to pull data from delivery schedules and receipt records.
Category reports
These procurement reports break down procurement activities into categories depending on the purchased goods or services. Such reports enable the procurement department to track spending across specific categories, identify underperforming ones, and uncover insights that help optimize category management strategies.
For instance, a ”Raw Materials Procurement Overview” can show trends in spending on steel, plastics, or other materials in manufacturing. To generate this type of report, it’s important to organize procurement data by item categories. It’s also a good practice to compare spending trends month-to-month or year-to-year to identify cost fluctuations or over-purchasing trends.
Budget reports
Budget reports help stakeholders monitor spending against allocated budgets. These procurement reports provide a snapshot of how much of the budget remains and how funds are being distributed. When the procurement team makes better decisions based on the budget visibility, they can track progress with the procurement savings dashboards. Overall, budget reports help companies ensure financial accountability, precise financial forecasting, and timely decision-making.
For instance, a “Departmental Budget Utilization” report shows which departments are approaching their limits and which have unused budgets. To create a report like that, it’s important to integrate data about the allocated budget and actual spending records.
Contract reports
Contract reports focus on the terms, execution, and status of procurement contracts. They help track contract compliance, renewal dates, and whether agreements are delivering the promised value. These reports are essential for managing risks. For example, procurement managers can create a “Contracts Expiring in the Next Quarter” report to proactively plan renewals or renegotiations. To do this, a central contract database is needed, so that the contract start and end dates would be easy to find.
Inventory reports
Inventory reports are crucial for tracking the stock levels of goods and materials a company holds. They help procurement teams monitor current inventory, avoid stockouts or overstocking, and ensure that the company always has the right amount of materials on hand. For instance, a “Stock Level Report” with the current quantities of all items in stock helps companies see which item supplies are sufficient and which may be running low. To create such a report, it’s important to gather data from purchase orders, delivery records, and manual stock counts.
Procurement document reports
Reports and procurement KPI dashboards based on different types of procurement documents (purchase orders, invoices, and receipts) offer a granular look at the transaction lifecycle. For example:
- A “Purchase Order Report” can distinguish approved, pending, and completed orders.
- An “Invoice Report” helps accounts payable and procurement teams track payment statuses and invoice discrepancies.
- A “Receipt Report” highlights if goods or services were received as expected.
Compliance reports
Compliance reports can also help ensure that purchasing activities meet procurement policies, industry standards, and legal requirements, especially for companies in highly regulated industries. For instance, by comparing purchase records against regulatory requirements (like environmental standards or safety certifications), procurement compliance reports can help ensure that the company isn’t inadvertently violating laws. This kind of reporting is key to avoiding costly fines or penalties.
Challenges in procurement reporting
Even though procurement reporting is essential for improving procurement operations and decision-making, many organizations encounter challenges that can diminish the impact and reliability of their reports. Here are some of the most common issues:
Data accuracy and consistency
One of the biggest challenges in procurement reporting is ensuring that the data used in reports is accurate, complete, and consistent. Often, procurement data comes from multiple sources, such as different departments, suppliers, spreadsheets, and systems. If these sources are not properly integrated or standardized, procurement managers deal with data discrepancies, errors, or incomplete information, which affects the quality of the procurement dashboards and reports.
Manual data entry
Many organizations still rely on manual data entry for procurement benchmarking dashboards. While this approach can get the job done, it’s time-consuming, exhausting, and less reliable. Manual entry slows down the reporting process, making it harder to generate timely and actionable insights. Moreover, manual input increases the risk of errors, especially when dealing with large volumes and complex procurement data. For example, when creating procurement savings dashboards for several subsidiaries. As a result, stakeholders might come to incorrect conclusions and miss important opportunities for improvement.
Data overload
With an increasing amount of data available, procurement teams can struggle to sift through irrelevant information and focus on what really matters. Too much data can also overwhelm decision-makers, leading to analysis paralysis. It becomes difficult to pinpoint key trends or come up with good strategies without clear guidelines on how to effectively prioritize and organize the data for the procurement analytics dashboard.
Lack of real-time data
Real-time procurement reporting dashboard is essential for making quick, informed decisions. However, many organizations still rely solely on periodic reports that reflect past performance. This lag in data makes it harder to act swiftly on emerging issues, such as supplier delays or unexpected overspending, and can lead to missed opportunities or unresolved problems.
Difficulty in standardizing reports
Organizations often struggle with standardizing procurement reports across different departments, teams, and entities. Without standard formats and templates, the reports are bound to become inconsistent and difficult to compare, which leads to confusion or misinterpretation of the data. Inconsistent reporting also makes it hard to measure performance against set goals.
Best practices for smooth procurement reporting
Effective procurement reporting isn’t just about generating data — it’s about making that data work for you. By following these best practices, you can create reports and procurement KPI dashboards that drive informed decisions and deliver real value without the previously mentioned pitfalls.
Standardize report formats
Consistency is key. When all procurement reports and procurement KPI dashboards follow a uniform structure, stakeholders immediately know where to look for required information. This clarity is essential for reducing the time burden and eliminating confusion that often results from the need to interpret varied layouts or unfamiliar terms. Format consistency fosters better communication between departments, ensuring everyone is on the same page regarding key procurement metrics like spend by category, supplier performance, or budget utilization.
Moreover, standardized reporting builds trust in the data. When everyone knows that reports adhere to the same structure and standards, they are more likely to rely on the accuracy and relevance of the provided insights. This consistency is especially valuable during high-stakes decision-making, like evaluating supplier contracts or reallocating budgets, when misinterpretations or discrepancies can lead to costly mistakes.
Use technology
Now, there is an increased demand for cloud computing technologies that concentrate on providing smart analytics within the procurement market. Financial reporting software for procurement automates data collection and analysis, saving procurement teams countless hours that would otherwise be spent on compiling and cross-checking numbers manually. Procurement automation not only frees up procurement teams to focus on strategic initiatives but also reduces the risk of costly mistakes or misinformed decisions caused by human errors.
Additionally, financial reporting software for procurement teams offers real-time updates, which means that reports reflect the latest data, enabling faster decision-making and problem resolution. To ensure that data is complete, it’s a good idea to choose a solution that offers integration with your ERP and accounting systems. Upon implementing integrations, you’ll have a holistic view of procurement activities and a seamless data flow between procurement and other business functions like finance and operations.
Focus on actionable insights
Data for the sake of data is a missed opportunity and wasted time. By looking into every possible procurement report and purchasing KPI dashboard, procurement teams can get overwhelmed and obscure the insights that actually matter. Instead, focus your reporting efforts on actionable insights to ensure that you work with data that drives meaningful decisions rather than just fills up spreadsheets.
For example, rather than producing reports and procurement dashboard examples on every single supplier, prioritize identifying suppliers with poor performance or higher-than-average costs. Highlighting these risks can help guide renegotiations or supplier diversification efforts.
Similarly, instead of creating exhaustive spend reports across dozens of categories in your procurement spend analysis dashboard, zero in on the ones where you’ve seen the biggest price fluctuations or where consolidation might save costs (which you may also track with the procurement savings dashboard).
Also, instead of just displaying numbers, make sure procurement reports offer actionable recommendations. For instance, if you notice a pattern of overspending in a particular category, make sure to recommend solutions like consolidating purchases with preferred suppliers to secure bulk discounts. Or, if the procurement savings dashboard highlights achieved savings, include information on how they were accomplished to emphasize effective cost-saving strategies.
Leverage data visualization tools
Reports in spreadsheets are undeniably super informative and useful. However, they may overwhelm stakeholders with countless rows and columns of information. That’s why you may want to incorporate procurement dashboards. They take the data from your spreadsheets and transform it into dynamic, easy-to-digest visuals. Instead of scanning through hundreds and thousands of spreadsheet cells, decision-makers can instantly identify trends, spot anomalies, and assess performance through interactive procurement dashboard templates.
That’s why it’s nice to choose financial reporting software for procurement that offers a built-in purchasing KPI dashboard and integrates with visualization tools like Power BI. Precoro would be a good example of such software. By making data more accessible and intuitive, procurement dashboards in Precoro empower teams at every level to make informed decisions faster.

Determine the optimal reporting frequency
While it’s beneficial to look through the procurement dashboard with key procurement data daily or weekly, the frequency of creating procurement reports depends on the industry of the business, the volume of purchases, and the specific needs of the procurement team.
-
Weekly reports are ideal for tracking short-term trends, operational tasks, and time-sensitive data. Companies usually use them to monitor order statuses, address urgent supplier issues (like late deliveries), or track actual spend against budgets in fast-paced business environments.
-
Monthly reports offer a broader view, helping procurement teams assess performance over a longer period. These are great for supplier performance reviews or spend analysis. A monthly procurement report might summarize spending across departments, allowing procurement managers to address deviations or adjust strategies before they snowball into larger issues.
-
Quarterly reports are essential for strategic planning and long-term evaluations. They allow procurement teams and executives to reflect on spending by category, supplier contracts, and procurement strategy alignment. For example, a procurement spend analysis dashboard based on the quarterly report might identify seasonal pricing trends or reveal opportunities to consolidate suppliers for better terms. These insights can then guide strategy discussions in board meetings.
-
Yearly procurement reports provide a comprehensive overview of procurement performance over a long timeframe. They help companies evaluate the overall success of procurement initiatives and offer a detailed breakdown of the past spending patterns, which is essential for setting budgets and forecasting expenditures for the next fiscal year. On a yearly basis, companies usually analyze spending (often incorporating visual tools like a procurement savings dashboard to present the data), supplier performance, budget adherence, and key metrics like purchase order cycle times, cost per invoice processed, and on-time delivery rates.
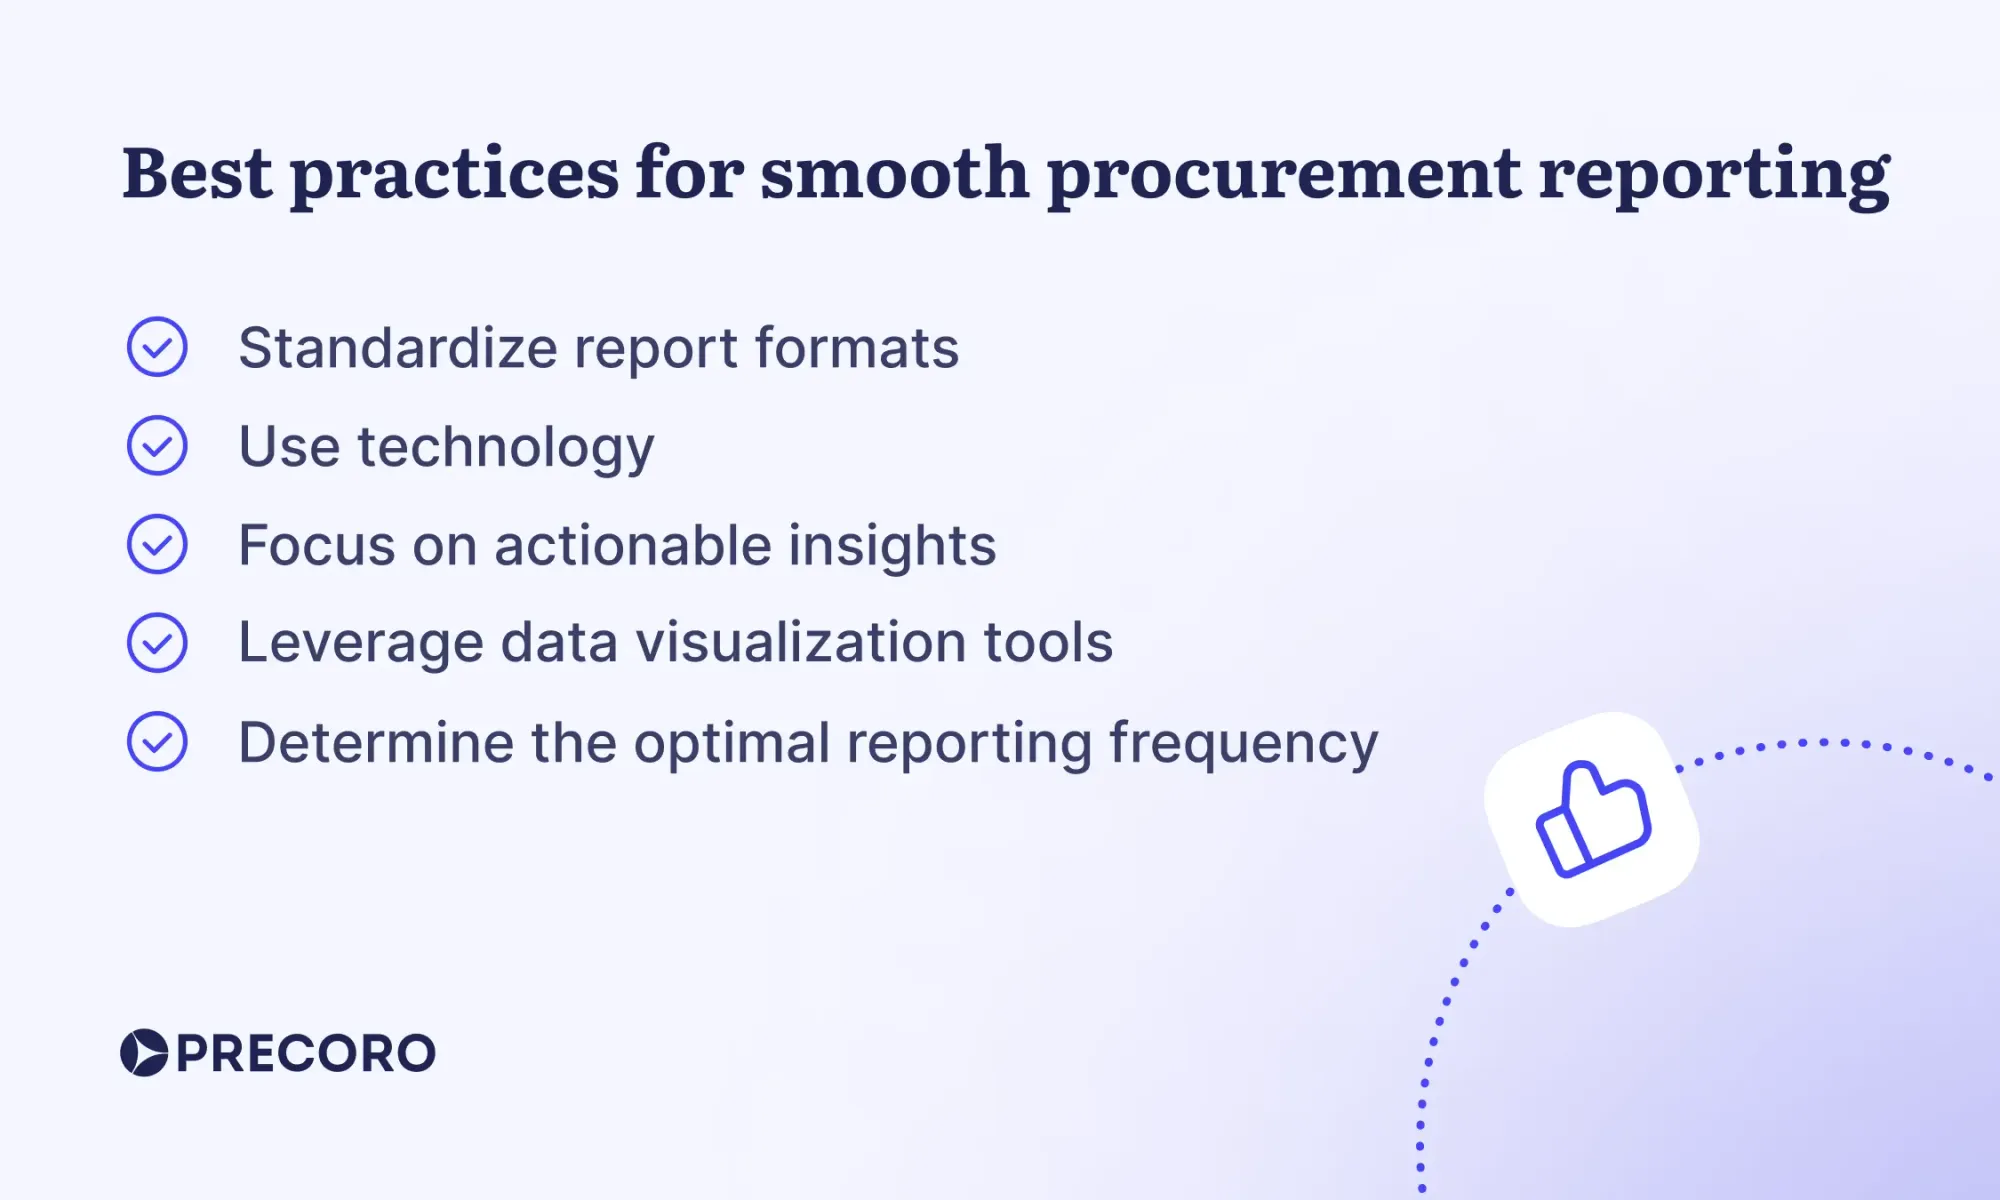
By following these best practices, organizations can tackle common procurement reporting challenges head-on, improving both the accuracy and effectiveness of their procurement KPI dashboards.
How Precoro can enhance your procurement reporting
Precoro is designed to centralize procurement operations and provide procurement teams with visibility into company-wide requests, purchases, budgets, and spending. Since companies can manage their entire procurement process in Precoro, and the system has a comprehensive reporting module, it serves as a perfect financial reporting software for procurement teams.
Precoro offers three categories of procurement reports:
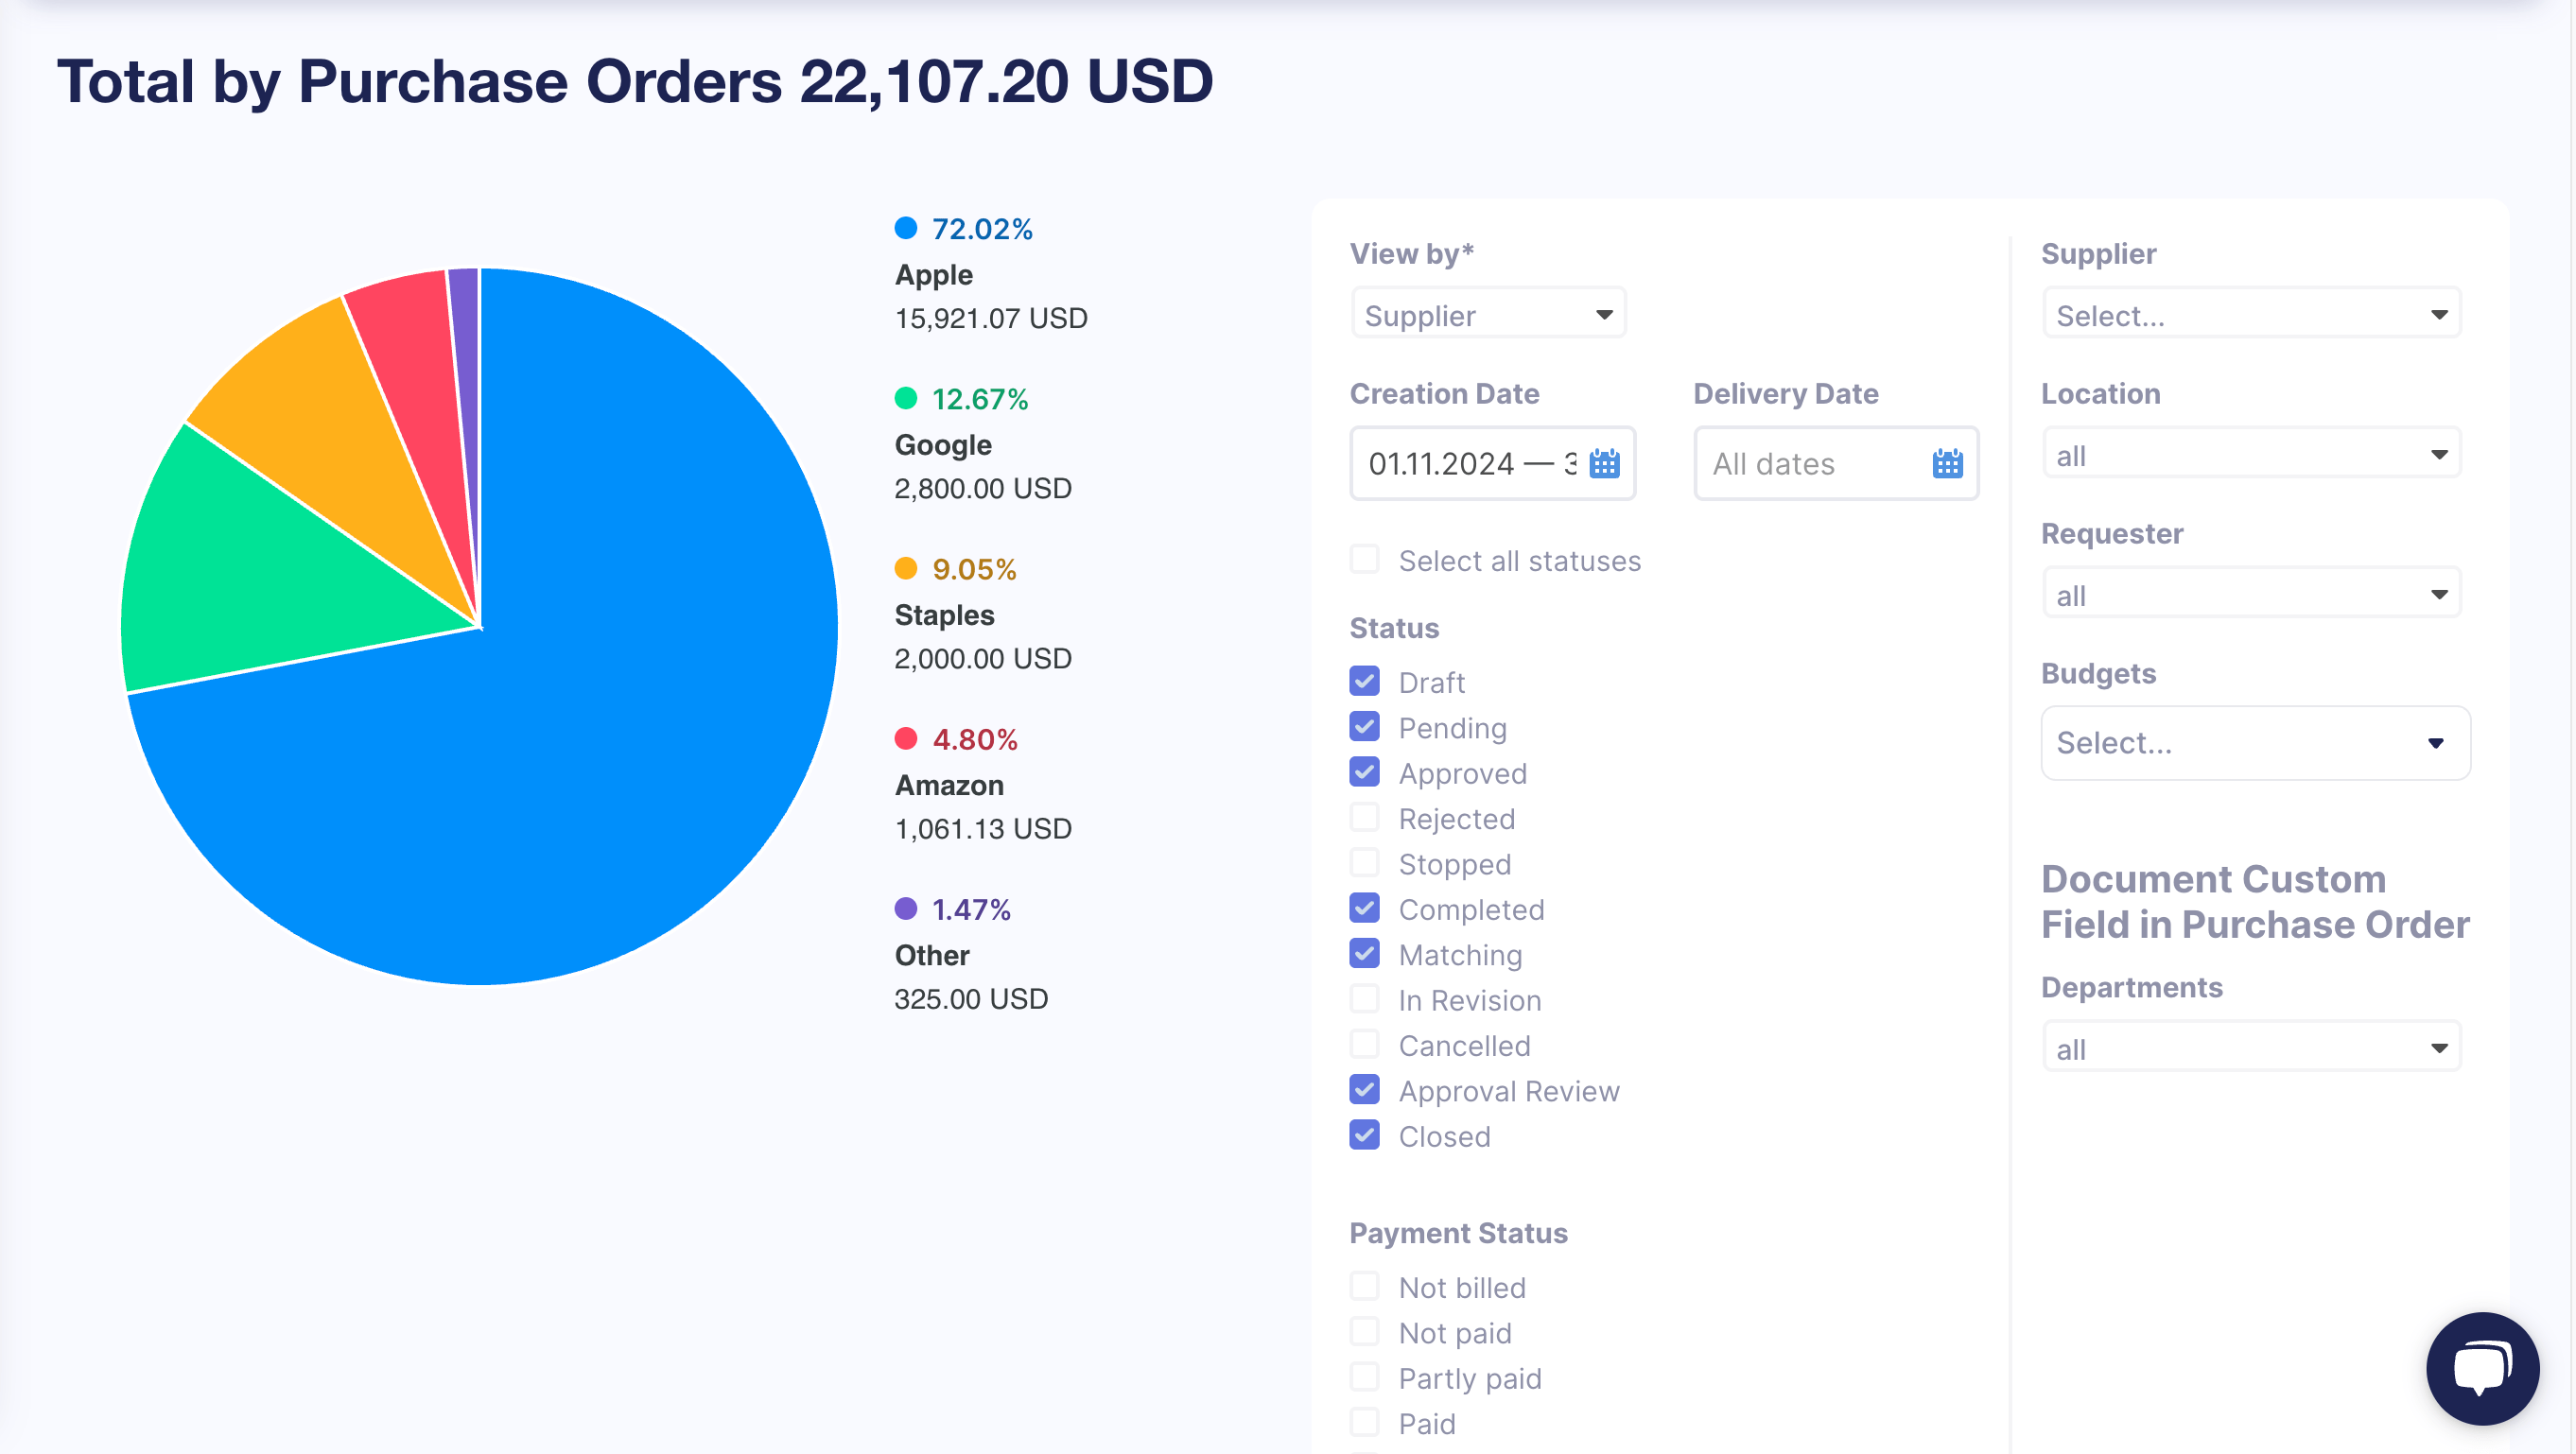
Visual charts
This category includes three key reports: total by purchase requisitions, purchase orders, and invoices. Users can analyze the data by criteria such as supplier, location, or department and even customize the report further with factors like requester, budget, or any custom field. The visual charts are dynamically updated based on the selected criteria.
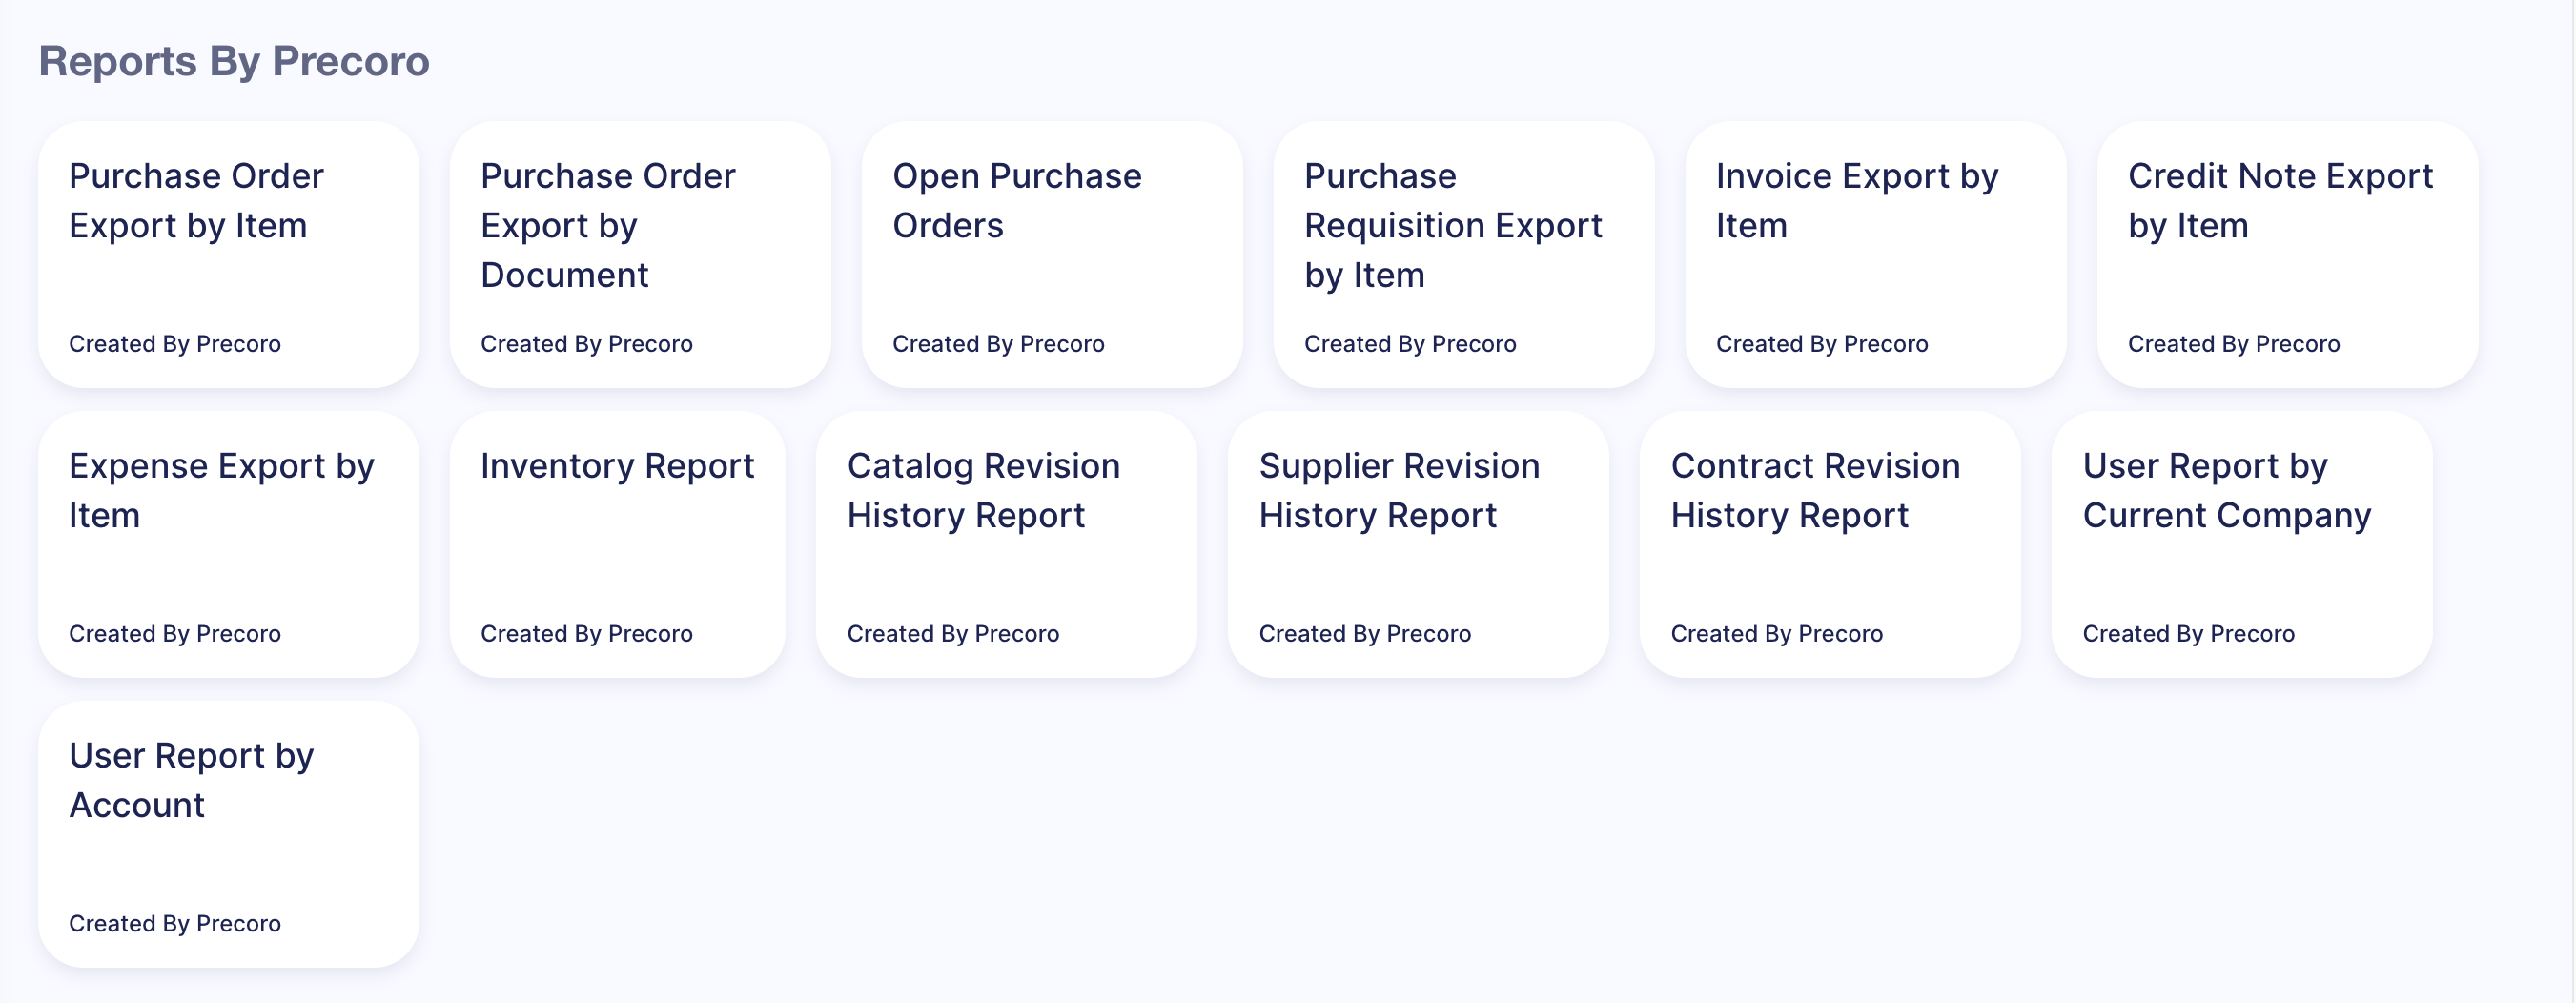
Preset reports
These reports feature organized rows and columns to help you analyze key procurement data, including purchase orders, inventory, catalogs, suppliers, contracts, and more. With just a few clicks, you can customize the timeframe and select the most relevant criteria for your analysis. Once generated, these reports can be easily exported to Excel, Google Sheets, or a Power BI procurement dashboard for advanced data visualization.
Custom reports
For the ultimate flexibility, Precoro allows users to generate fully customizable reports. Whether you’re focusing on specific documents or analyzing a particular stage of the procurement process, you can set up unique reports to meet your company’s specific needs.
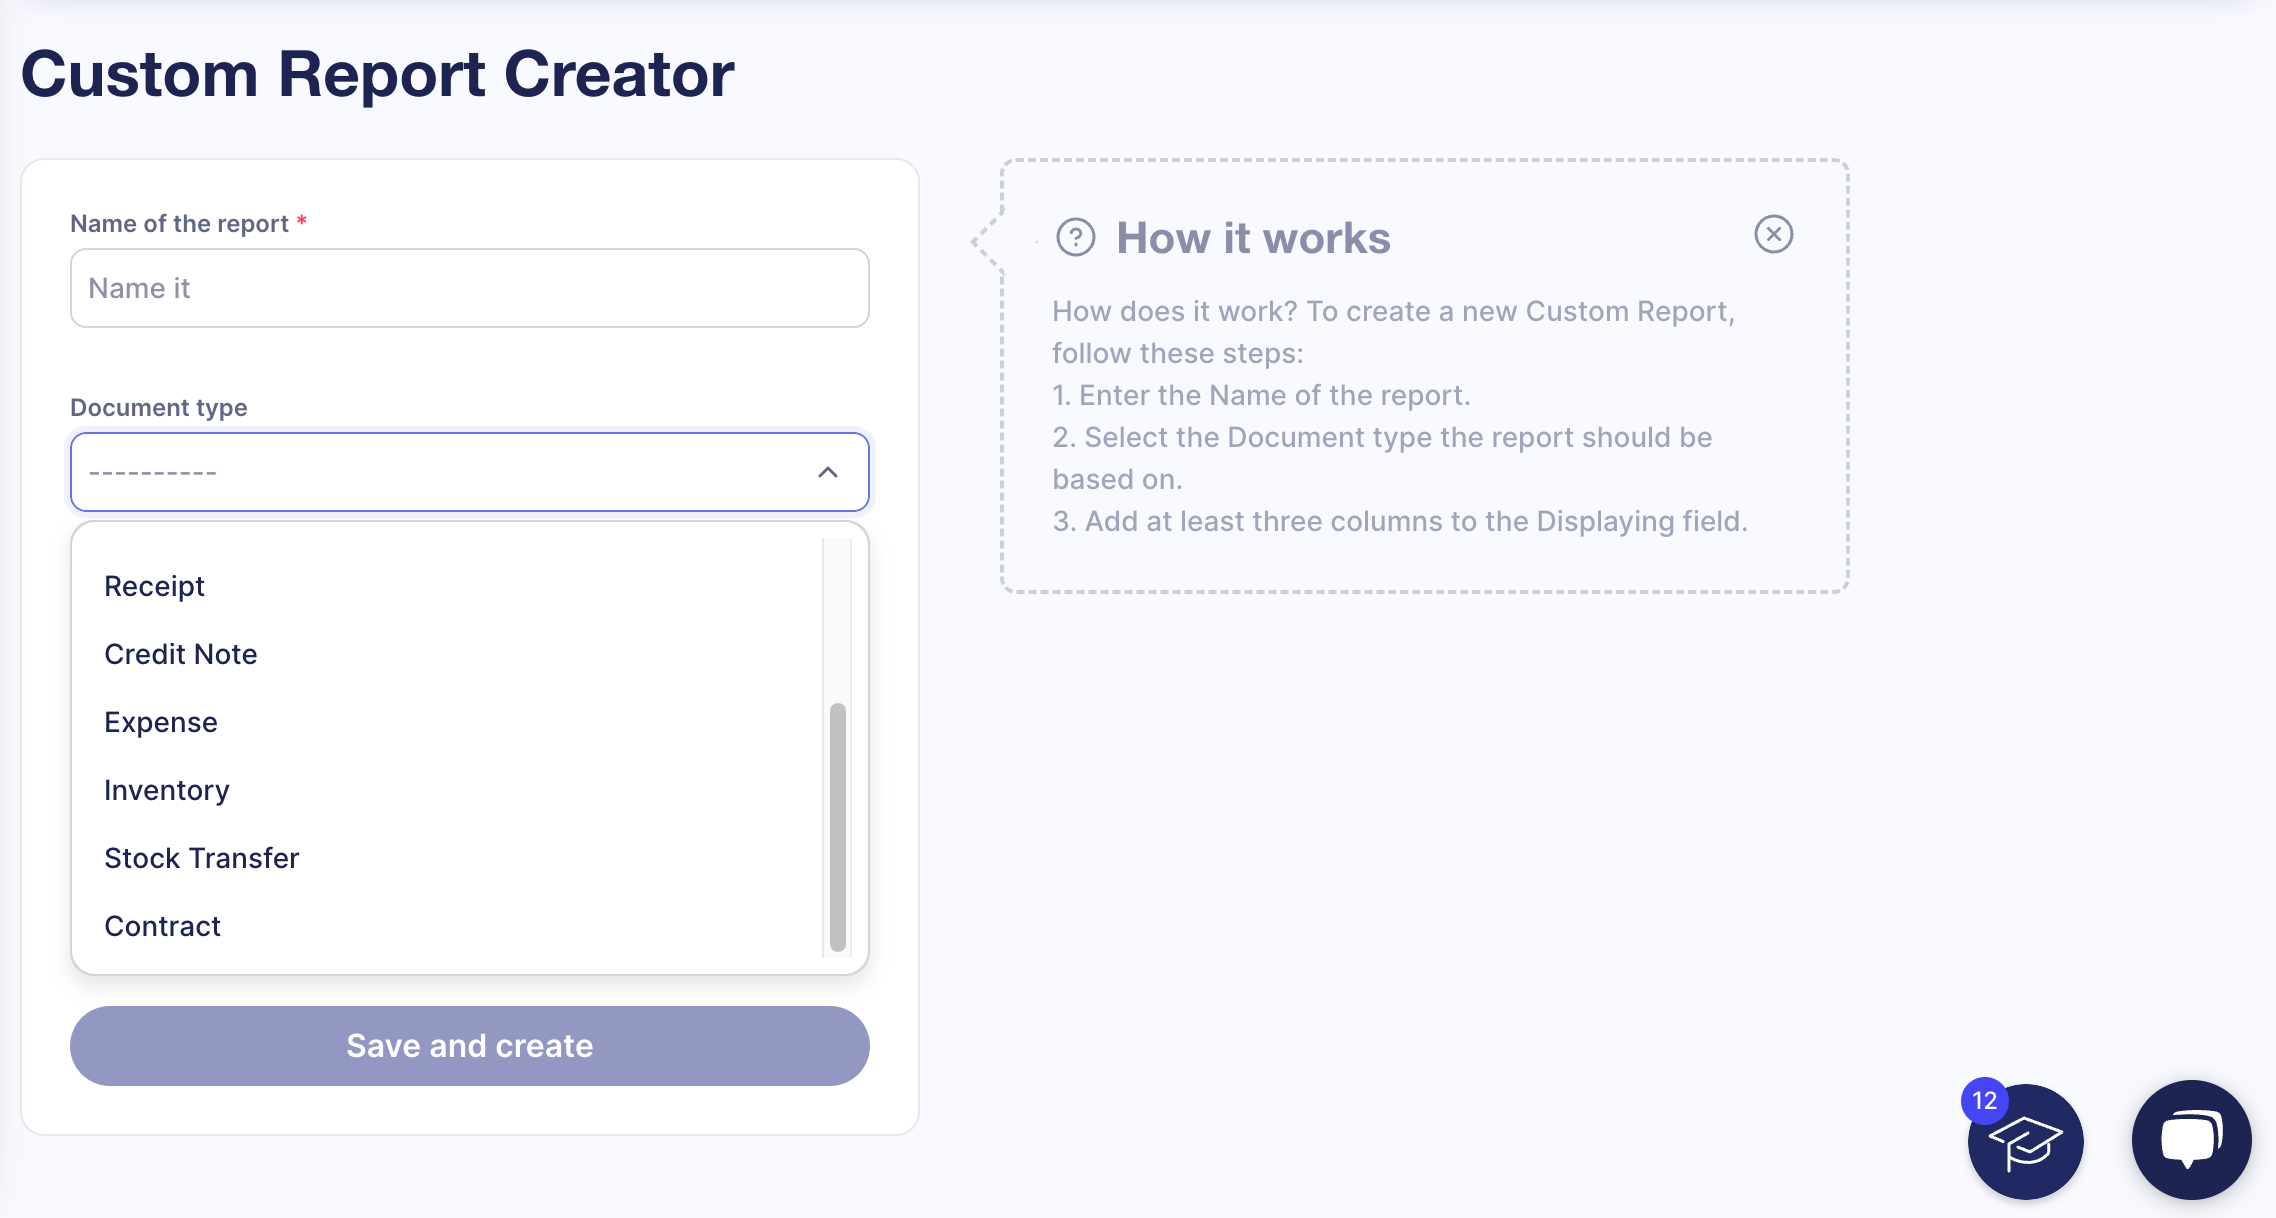
Precoro doesn’t just help you create reports — it helps you maintain them. Users can save their preferred report templates and make adjustments as needed, ensuring consistency across the board. Plus, you can automate the generation of periodic reports, seamlessly integrating them with Power BI for stunning, easy-to-read procurement dashboards that provide up-to-the-minute insights into your procurement activities.
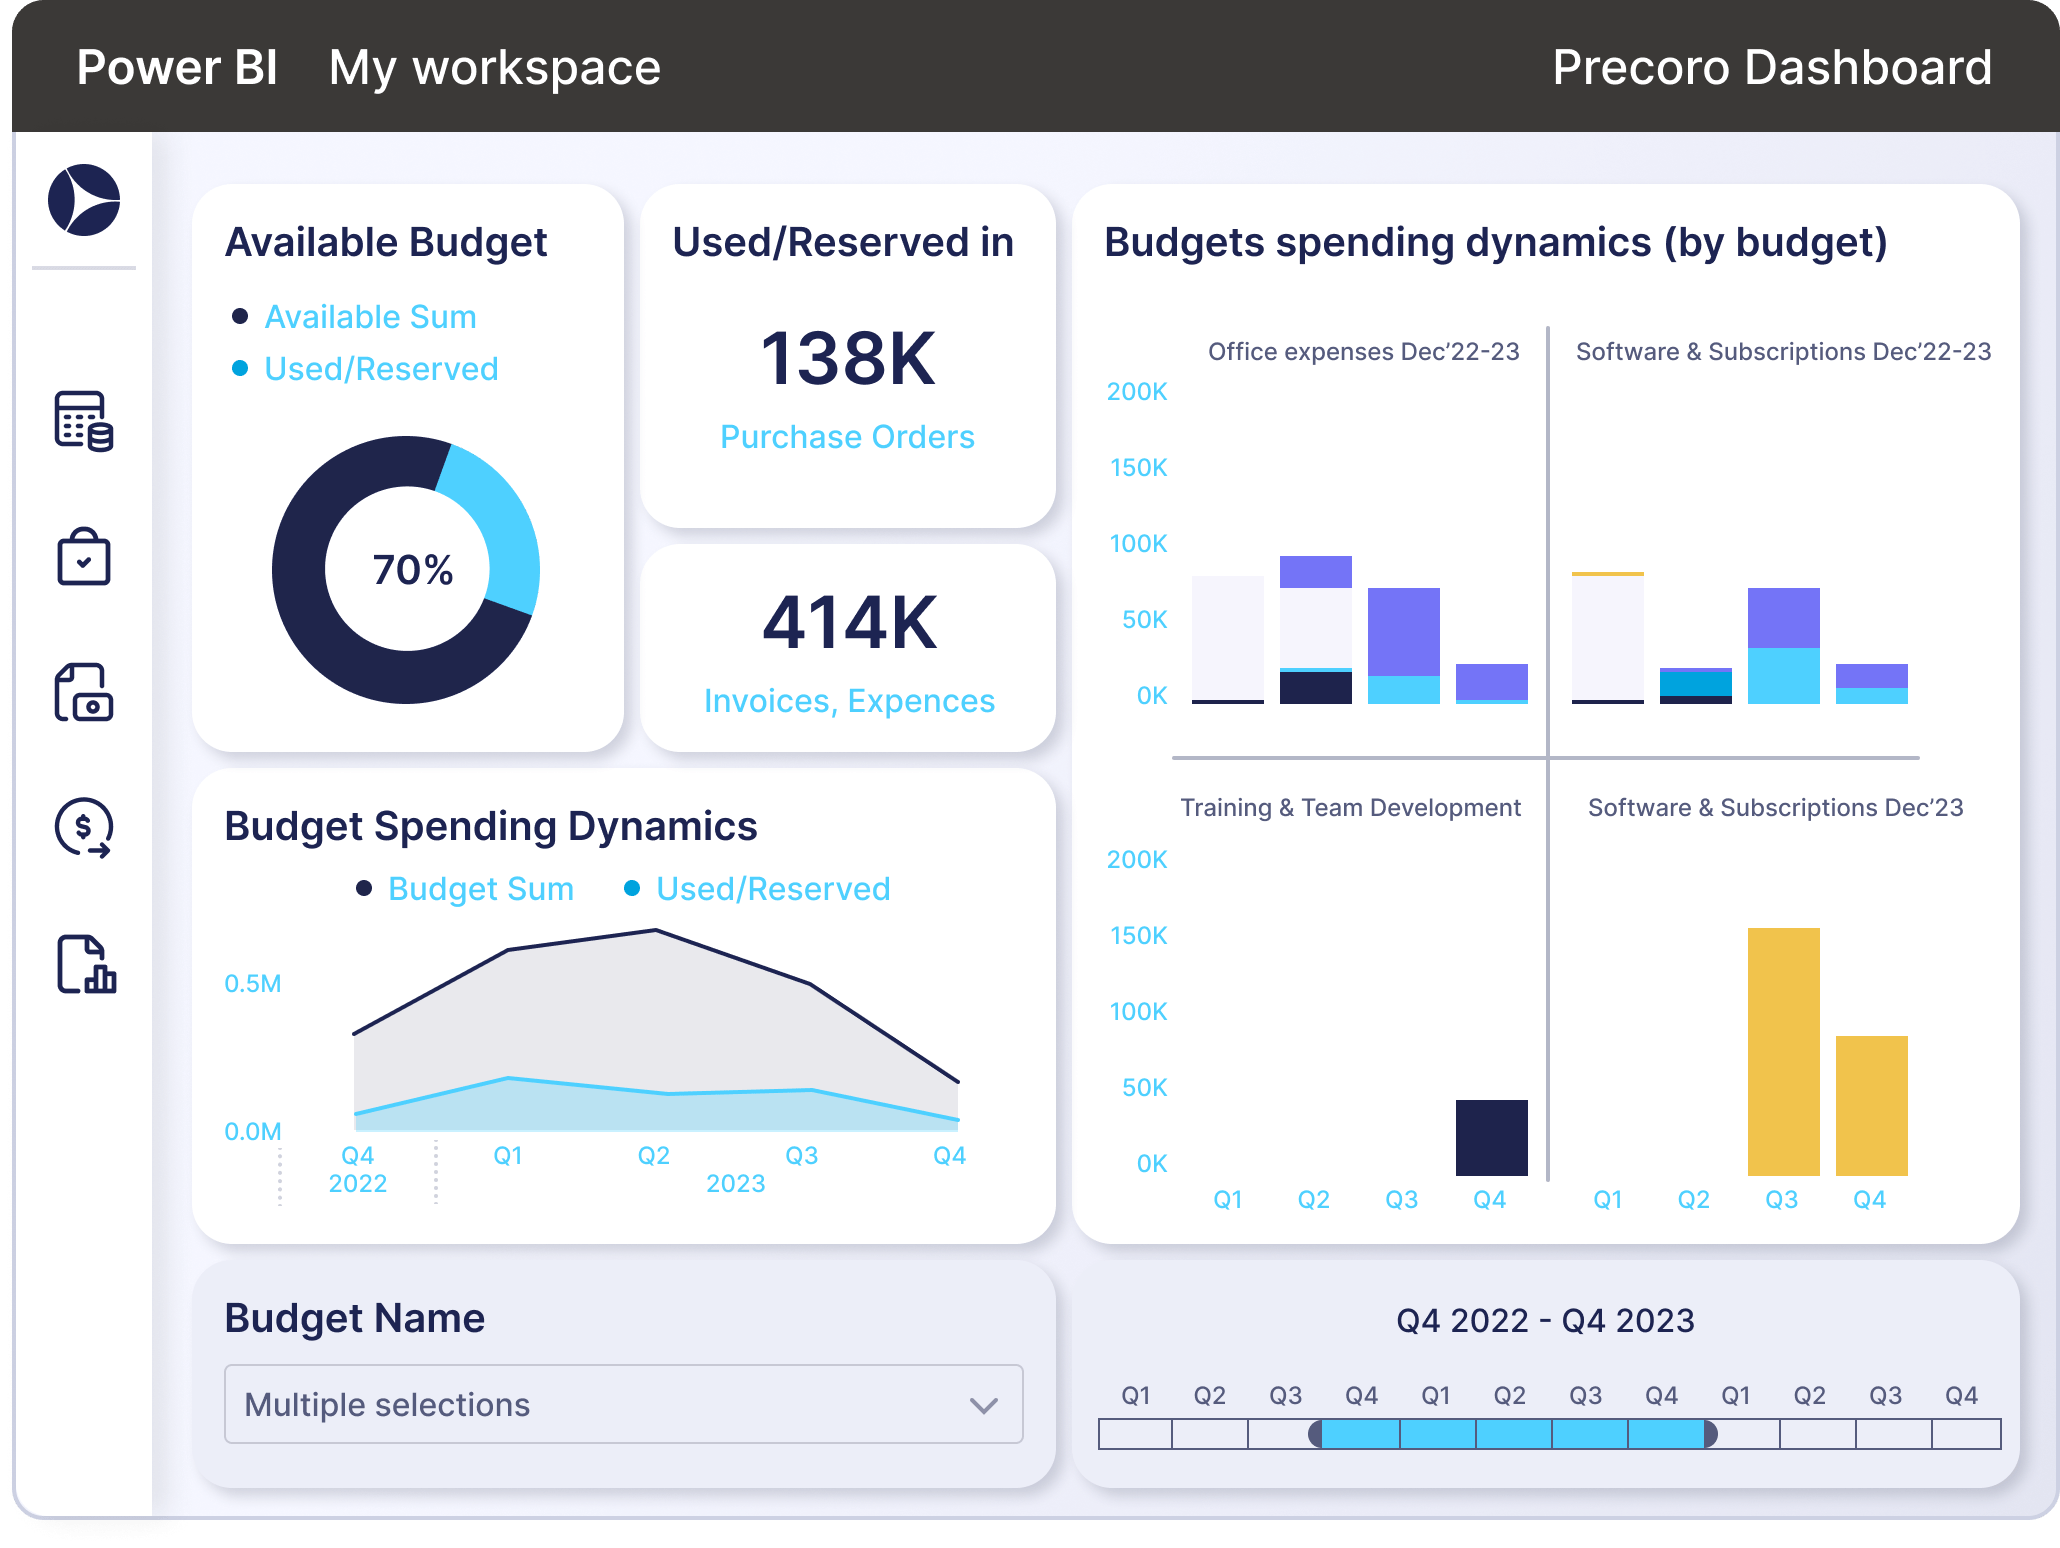
Moreover, Precoro's modern dashboards provide more than visibility—they drive actionable insights. Key benefits include:
- Centralized data view: Procurement, spend, and accounts payable information is integrated into a single platform.
- Real-time insights: Track budgets, commitments, and supplier performance with instant updates.
- Interactive visualizations: Drill down into charts and graphs to explore specific trends and anomalies.
- AI-Powered Analysis: Ask questions directly in the dashboard to uncover patterns, delays, or overspending.
- Role-based customization: Each user sees the metrics that matter most to their responsibilities, which improves focus and decision-making.
Frequently Asked Questions
Procurement reporting is the process of collecting, analyzing, and presenting data related to sourcing and purchasing activities. It helps organizations track spending, monitor supplier performance, ensure compliance with internal policies and industry standards, and make informed decisions to optimize the entire procurement process.
Procurement reports should be generated based on the needs of the business and the decision-making strategy. Weekly reports are ideal for keeping tabs on any emerging issues in the procurement process. Monthly reports offer a broader view of procurement performance, helping to assess cost-saving opportunities, supplier performance, and budget adherence. Quarterly reports provide a more strategic overview, useful for long-term planning, supplier negotiations, and assessing overall procurement effectiveness. Annual reports are typically used for year-end reviews, budget planning, and forecasting for the upcoming year.
A procurement dashboard is a visual interface that displays key metrics and data in real time. Dashboards consolidate key procurement data like spending trends, supplier performance, and budget usage into an easy-to-read format, often using charts and graphs. For example, a procurement savings dashboard focuses on tracking and visualizing achieved cost savings.
Procurement reports provide detailed, often static data that helps assess past performance and identify trends, whereas procurement analytics dashboards offer dynamic, real-time visualizations that allow users to interact with data and monitor key metrics on a daily basis. Simply put, while reports provide in-depth information for deeper insights and historical trends, procurement dashboards offer a snapshot of procurement performance for immediate action.
Take full advantage of procurement reporting
Procurement reporting isn’t just another checkbox in your operations — it’s the backbone of smart business decisions. Whether you’re trying to proactively act on uncompleted orders, identify sources of overspending, or keep tabs on contracts, good reports and procurement KPI dashboards help you see the big picture and recognize problems before they grow.
By using financial reporting software, procurement teams consolidate all procurement data in one place instead of scrambling through piles of paperwork or hunting down old spreadsheets. Precoro takes care of generating automatic reports, lets you customize them to your heart’s content, and plays nice with Power BI for a slick, easy view of your data — all while providing top-level security and rock-solid support. The most important and relevant data is displayed in the system’s procurement analytics dashboard. All of these capabilities were designed to help you spot inefficiencies and quickly find solutions that are perfectly aligned with your business goals.


