
36 min read
Accounts Payable Days: Calculate DPO (Days Payable Outstanding)
Days Payable Outstanding measures how long companies take to pay suppliers. Learn to calculate DPO, compare benchmarks, and optimize payment timing.
Ever wonder how some companies seem to always have cash on hand while still keeping suppliers happy? Days Payable Outstanding holds the answer. This simple metric shows how long your business takes to pay vendors and provides critical input for accounts payable forecasting.
Learn how to master it to free up cash for growth, smooth operations, or unexpected expenses, all without damaging supplier relationships.
Read on to find out:
What is Days Payable Outstanding (DPO)?
Understanding benchmarks: What is a good DPO?
Why should you calculate Days Payable Outstanding?
How to calculate Accounts Payable Days: The complete formula
Step-by-step guide: How to calculate your Accounts Payable Days
Common Accounts Payable Days calculation mistakes to avoid
Accounts Payable Days calculation examples and scenarios
How does DPO relate to the cash conversion cycle?
Accounts Payable Days vs. other payables and liquidity metrics
What factors affect your Days Payable Outstanding?
How can you improve your accounts payable days?
How do AP controls contribute to supply chain diversification and resilience?
Frequently asked questions about Days Payable Outstanding
What is Days Payable Outstanding (DPO)?
Days Payable Outstanding (also commonly referred to as Accounts Payable Days) is a financial metric used to measure the average time a company takes to pay its suppliers. The calculation of DPO reveals important information about a company’s cash flow management, supplier relationships, and the overall financial strategy. This metric allows businesses to balance cash flow needs with timely payments that maintain healthy vendor relations.
What does DPO measure in your business?
Days Payable Outstanding measures the average number of days a company takes to pay its vendors or suppliers after receiving goods or services. In other words, it tracks the time between creating a payable and settling it.
DPO provides insight into how effectively a company manages cash outflows and supplier credit. It focuses on accounts payable — the money owed to suppliers for inventory, raw materials, or services purchased on credit.
This information can be used to analyze payment cycles and determine whether cash outflow timing is optimized to begin with. Strategic control of DPO allows companies to preserve cash for potential investments, operational needs, or unexpected expenses.
At its core, DPO is simple: the longer the payment period, the more cash stays in the business. It answers a key question for financial managers: “How long can we hold onto cash before paying suppliers?” The DPO timeframe directly affects working capital, influencing how much liquidity a company needs for day-to-day operations, growth, or emergencies.
Understanding DPO helps businesses balance cash flow with strong supplier relationships.
Why is DPO considered a key financial metric?
DPO has become a key financial metric because it shows how efficiently a company manages one of its most important resources: cash. Financial managers and executives use it to see whether their business is maximizing the time value of money while maintaining strong vendor relationships.
This metric provides critical insight into cash flow management and directly affects a company’s ability to operate, invest, and grow. A well-managed DPO means businesses hold onto cash longer and may indicate successful negotiation of favorable payment terms, reflecting both bargaining power and financial stability.
Investors and creditors also examine DPO when they need to evaluate a company’s financial health. A consistent DPO is an indication of disciplined cash management with reliable operational practices. Alternatively, sudden changes in DPO can signal financial distress, such as delayed payments due to cash shortages, or reflect a strategic change in the company’s payment policies.
DPO is closely tied to working capital optimization, along with two other key metrics: Days Sales Outstanding (DSO) and Days Inventory Outstanding (DIO), which we’ll discuss later. Companies that can extend their DPO without harming supplier relationships effectively gain an interest-free loan from vendors, which is a positive indicator of liquidity and financial flexibility.
How does DPO differ from other cash flow metrics?
Days Payable Outstanding stands out from other cash flow metrics because it focuses on outgoing payments rather than incoming cash. While most liquidity metrics track how quickly a company collects money or converts assets, DPO measures how long a business takes to pay its suppliers. This key difference makes DPO unique among working capital indicators.
As noted earlier, each metric in the working capital optimization cycle serves a specific purpose and affects cash flow in a different way:
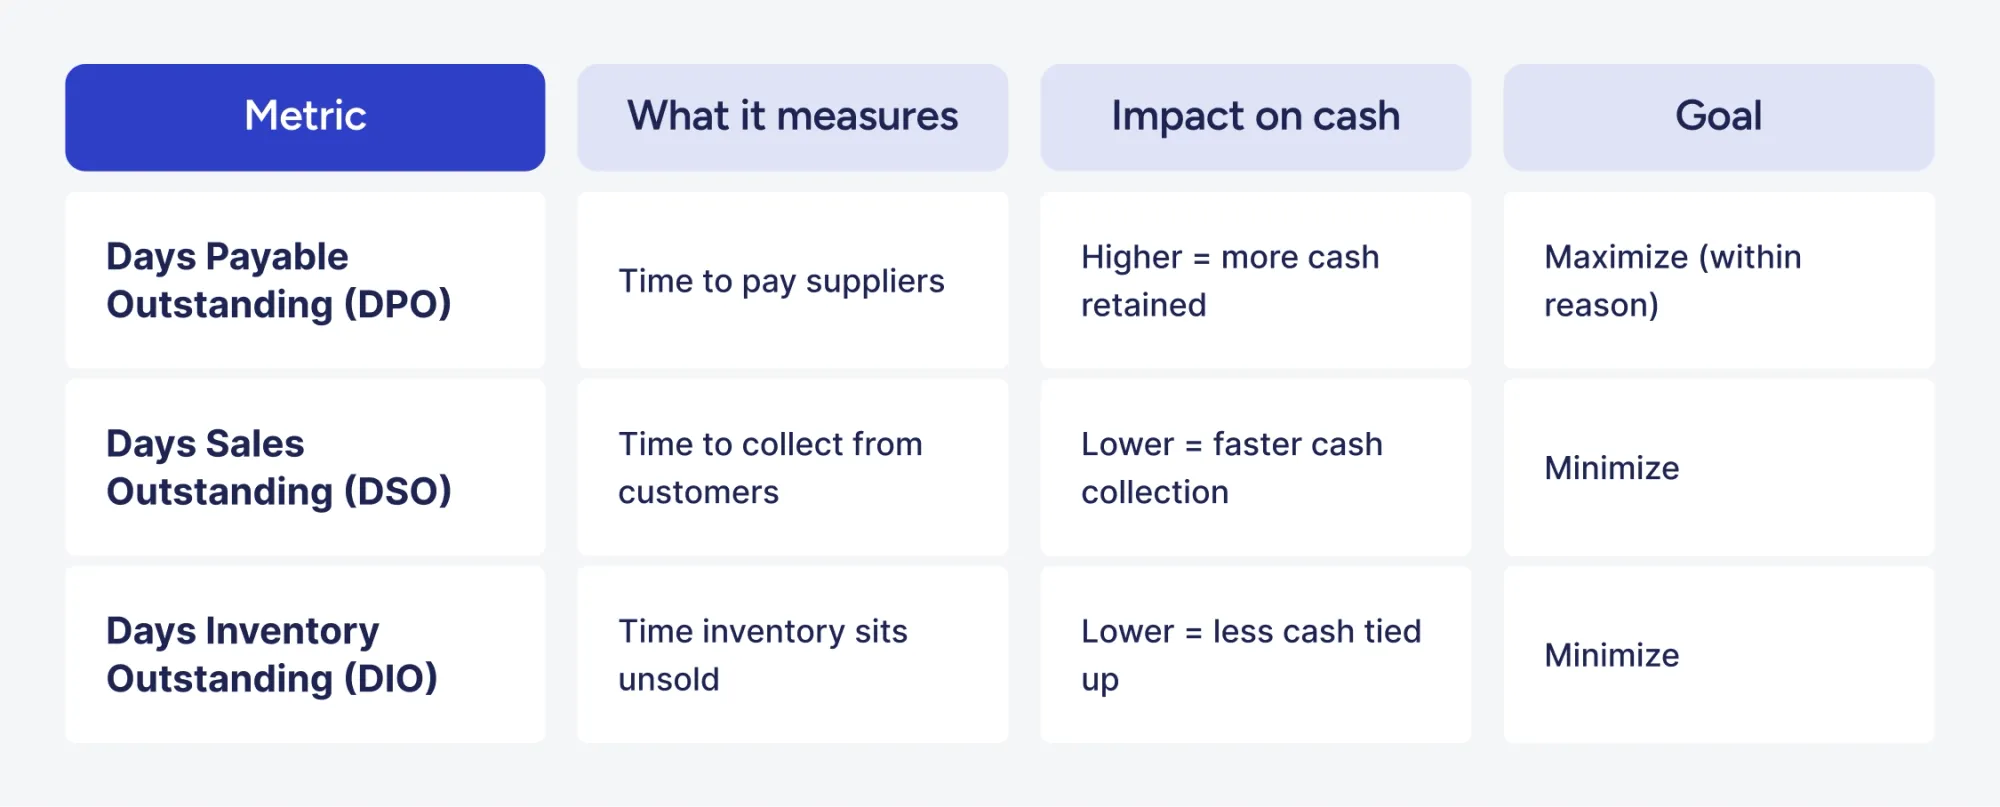
DPO reflects accounts payable, while DSO tracks accounts receivable, and DIO measures inventory. Understanding how these metrics interact helps financial managers identify opportunities to improve cash flow across the entire business.
The cash conversion cycle combines these metrics to show how long cash is tied up in operations, calculated as DSO plus DIO minus DPO. A shorter cycle indicates that a company can quickly turn investments into cash, which reduces its need for external financing.
What does a high or low DPO indicate about your company?
A high DPO means a company takes longer to pay its suppliers, which can reflect different business conditions. On the positive side, strong negotiating power may allow for extended payment terms (for example, net 60 or net 90), keeping cash in the business longer and showing financial stability.
However, a high DPO can also signal cash flow problems. Companies with liquidity issues may delay payments out of necessity, which can strain supplier relationships, disrupt supply chains, and lead to missed early payment discounts.
A low DPO means a company pays its suppliers quickly. This approach builds trust, strengthens vendor partnerships, and can help secure preferential treatment, priority during shortages, or better pricing. Companies with strong cash positions often maintain a low DPO to take advantage of early payment discounts, which can yield returns comparable to double-digit interest rates.
However, a low DPO can also signal missed opportunities. If a company pays in 15 days when terms allow 30 or 45, it gives up valuable cash flow flexibility without gaining meaningful benefits. It’s important to determine whether a low DPO reflects a strategic choice or poor cash management.
Industry context matters significantly here. Retail companies often maintain DPO ranges of 30-45 days, while manufacturing firms commonly extend their DPOs to 60-90 days because of their longer production cycles and stronger supplier relationships. Service businesses, on the other hand, tend to show a lower DPO because they rarely purchase physical goods in the first place.
Understanding benchmarks: What is a good DPO?
Determining a good Days Payable Outstanding depends on industry norms, business strategy, and supplier relationship dynamics. No universal benchmark exists because companies operate under different payment structures, cash flow needs, and vendor agreements.
The ideal DPO balances cash preservation with supplier trust and operational efficiency.
What is considered a healthy DPO for your industry?
A healthy DPO balances industry standards with your company’s cash flow goals and supplier relationships. Industry benchmarks offer a useful reference, but specific business circumstances may justify deviations.
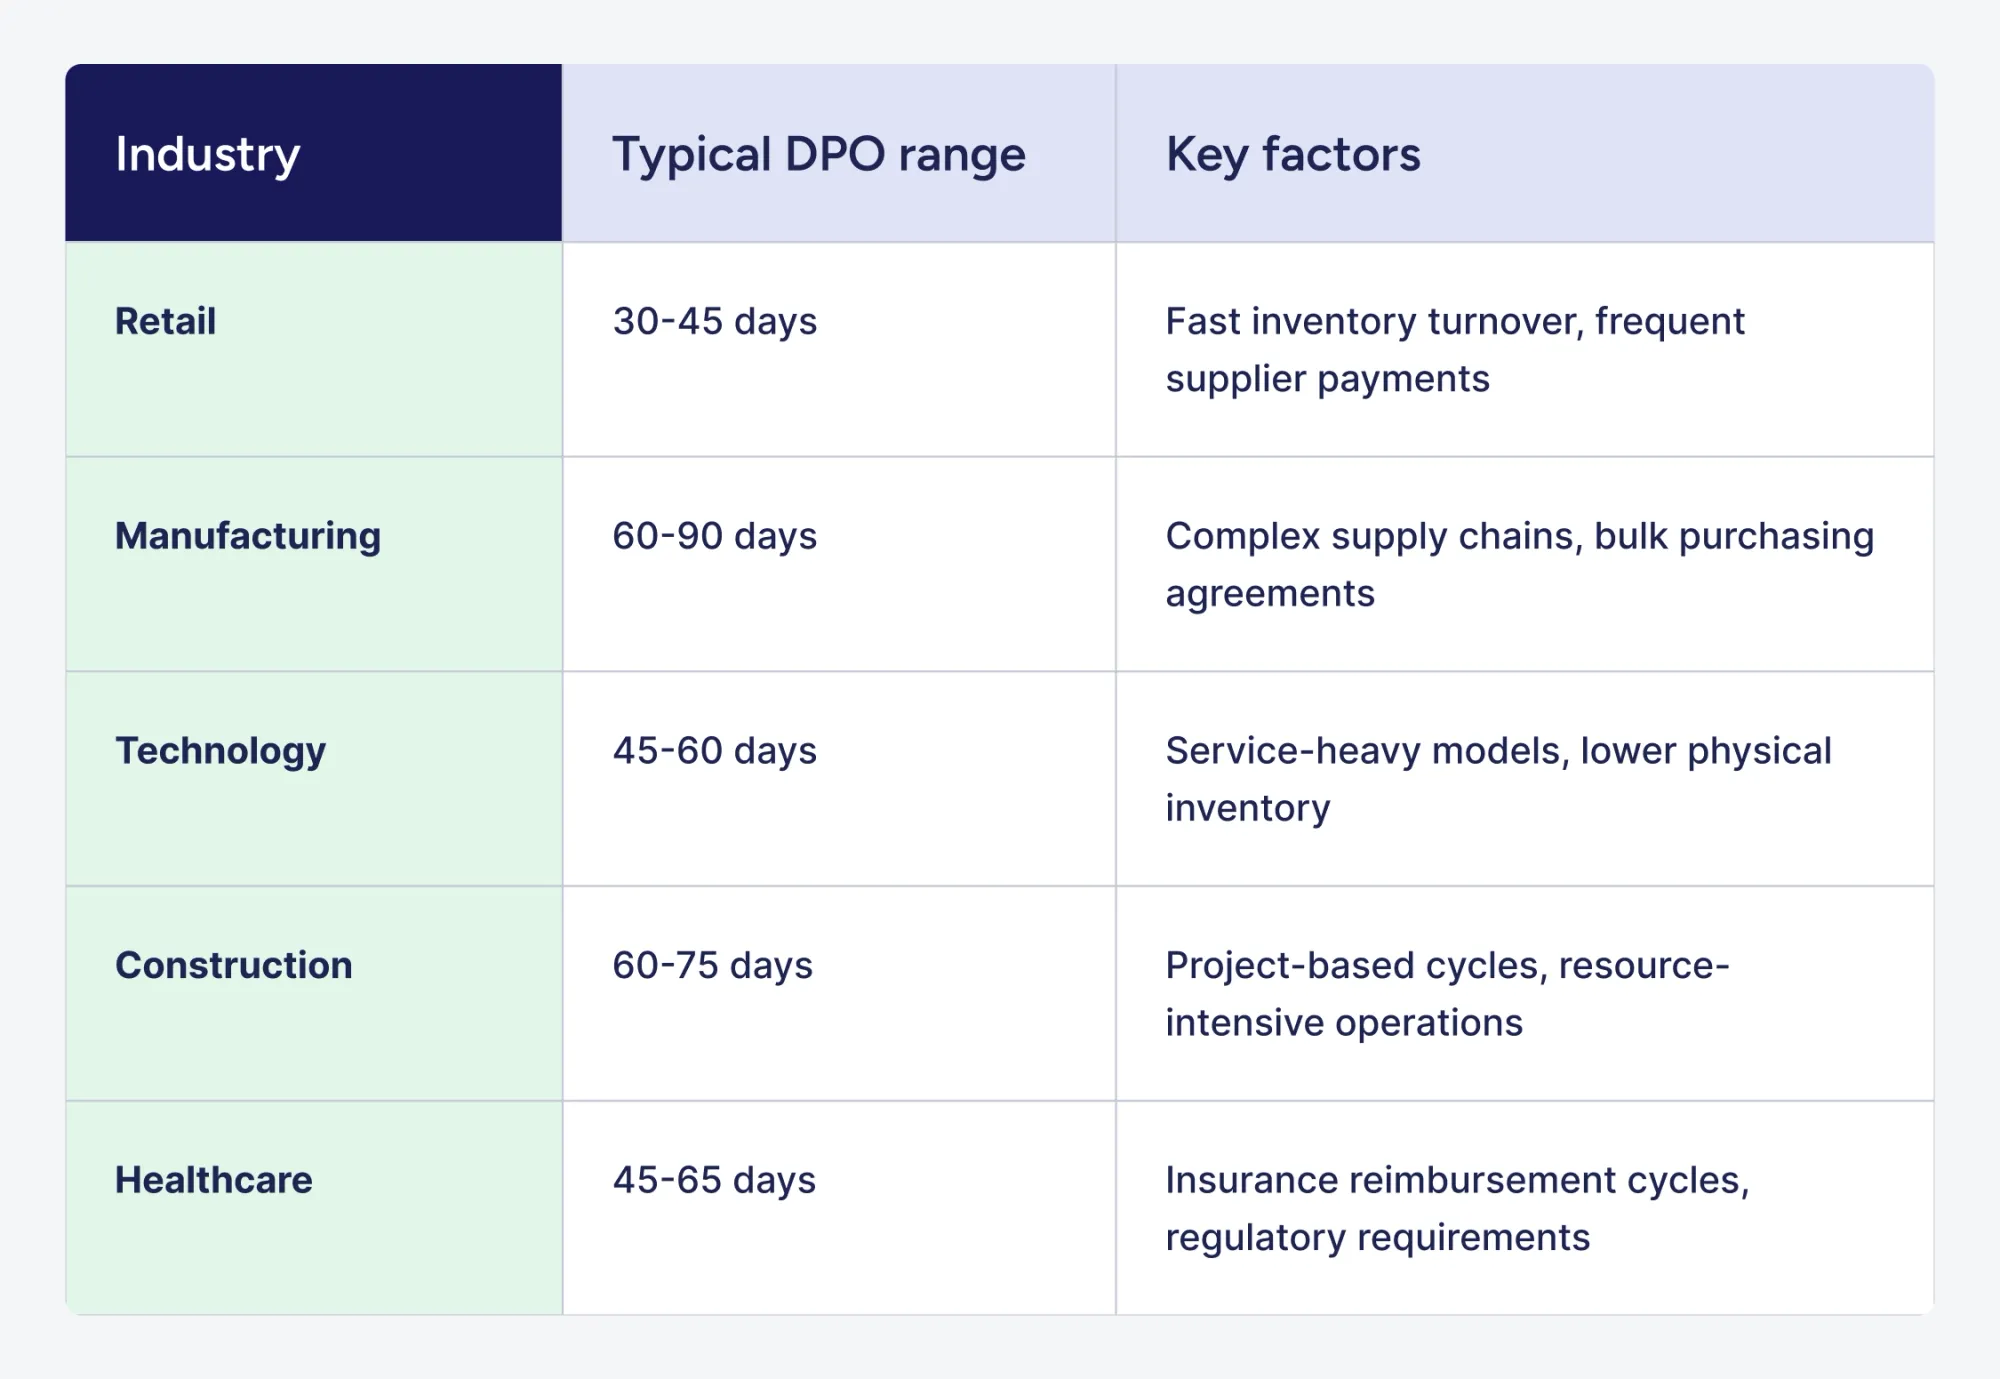
Different industries have their own typical DPO ranges, shaped by operational models, supply chain structures, and other factors.
A good DPO falls within your industry range while leaving room for strategic adjustments. Companies at the higher end of the benchmark usually have stronger negotiating power or more flexible cash positions. Those at the lower end may focus on strengthening supplier relationships or taking early payment discounts that outweigh the cost of paying sooner.
The key is to compare your DPO with direct competitors, not companies in unrelated sectors. For instance, a 45-day DPO may be below average for a manufacturing firm, which typically pays suppliers over 60 days, but above average for a retail business, where 30 days is more common.
How does DPO vary across different sectors?
DPO varies across sectors due to differences in business models, inventory needs, and supplier relationships. Each industry’s payment patterns reflect its unique operational challenges and cash flow characteristics.
- Manufacturing (60-90 days): Manufacturers often maintain higher DPO because they purchase raw materials in bulk and negotiate long-term supplier contracts. Large, consistent orders give manufacturers significant leverage with suppliers. The capital-intensive nature of the sector, combined with strong vendor relationships, allows for extended payment terms.
- Retail (30-45 days): Retailers balance fast inventory turnover with maintaining supplier goodwill. Seasonal demand can extend payment cycles, especially during peak seasons. Large retailers use market power to negotiate favorable terms, while smaller retailers pay faster to ensure reliable inventory access.
- Service-based businesses (20-35 days): Service companies usually have a lower DPO because they purchase fewer physical goods. Expenses mainly include office supplies, software, and professional services.
- Technology (45-60 days): Technology companies fall in the middle. Hardware-focused firms follow patterns similar to manufacturing, while software-focused companies often have a lower DPO due to minimal physical inventory.
Is a higher DPO always better for your business?
A higher DPO isn’t always better despite the apparent advantage of retaining cash longer. Strategic payment timing requires balancing a number of factors beyond simple cash preservation.
Extended payment periods can strain supplier relationships, especially with smaller vendors who rely on timely payments for their cash flow. In response, suppliers may raise prices, offer less favorable terms on future orders, or prioritize other customers during shortages. In such cases, the cash retained through a high DPO can end up costing more than it saves.
Early payment discounts often provide returns that exceed the opportunity cost of paying sooner. For example, a 2/10 net 30 discount (2% off for payment within 10 days) equates to roughly a 36% annual return — far higher than most alternative investments. Forgoing these discounts to extend DPO means giving up guaranteed savings.
Market conditions and competitive positioning also affect the ideal DPO. During supply chain disruptions or material shortages, companies with strong payment histories are more likely to receive preferential treatment from suppliers. Maintaining a deliberately lower DPO can act as “relationship insurance,” paying off when supply is tight.
What are the risks of having Accounts Payable Days that are too high?
Excessively high DPO creates risks that can outweigh the benefits of delayed payments. These risks compound over time and may not become apparent until supplier relationships deteriorate or market conditions shift.
Supplier relationship damage is the most immediate risk of them all. Vendors who experience chronic late payments may reduce order priority, limit credit availability, or require cash-on-delivery terms for future purchases. Small suppliers facing their own cash constraints may refuse future business entirely, forcing companies to find alternative sources at potentially higher costs.
Key risks of excessive DPO include:
- Supply chain disruptions
Strained suppliers may delay shipments, reduce quality, or terminate relationships during critical periods. - Lost early payment discounts
Foregoing 2/10 net 30 terms costs approximately 36% annually in missed savings. - Price increases
Suppliers often raise prices to offset delayed payment risk and financing costs. - Credit rating impact
Payment patterns that suggest financial distress can lower creditworthiness assessments. - Reduced negotiating power
Poor payment history weakens leverage in future contract negotiations. - Legal and collections issues
Severely overdue payments can result in collection activity or litigation.
Companies sometimes extend DPO not by strategic choice but due to cash flow constraints, which is a signal of deeper financial problems. Creditors and investors are aware of such a pattern and may interpret high DPO as a warning sign instead of effective cash management.
The reputational damage from consistently slow payments can last long after a company’s cash situation improves, affecting a vendor’s willingness to offer favorable terms.
When does a low DPO actually benefit your company?
Low DPO benefits companies when the advantages of paying quickly outweigh the cost of holding less cash. Strategically accelerated payments can create financial returns and competitive advantages that justify faster cash outflows.
Early payment discounts are a clear way to benefit from a low DPO. For example, terms like 1/15 net 45 offer a 1% discount if payment is made within 15 days instead of the full 45. Taking this discount effectively yields an annualized return of about 12%, which is higher than most alternative investments or typical borrowing costs. Companies with available cash should generally take advantage of these opportunities to maximize returns and strengthen supplier relationships.
During tight markets or supply shortages, suppliers tend to reward companies with strong payment histories. Vendors facing capacity limits or scarce materials prioritize their most reliable customers, and maintaining a deliberately low DPO builds the trust that earns this preferential treatment.
When establishing new supplier relationships (such as entering new markets, launching product lines, or working with premium vendors), prompt payment demonstrates financial stability and credibility. A low initial DPO can speed up relationship-building and open access to better suppliers.
Cash-rich businesses can also optimize their entire vendor ecosystem by paying quickly. The goodwill generated, combined with captured early payment discounts and simplified payment processes, can create value that exceeds the cost of using cash.
Why should you calculate Days Payable Outstanding?
Calculating Days Payable Outstanding gives key insights into a company’s cash flow, supplier relationships, and overall financial health. The metric is valuable to a range of stakeholders, from finance teams managing working capital to investors assessing performance. Regularly monitoring DPO helps companies spot trends, make smarter payment decisions, and maintain healthy cash levels.
How do Accounts Payable Days impact your cash flow management?
Accounts Payable Days directly affect how much cash a company has available for daily operations, investments, and unexpected expenses. By controlling payment timing, companies can significantly influence liquidity and financial flexibility.
Even a modest extension can free significant working capital. For example, a company with $1 million in monthly supplier costs that increases DPO from 30 to 45 days would retain an extra $500,000 in cash. This capital can cover payroll, fund emergency repairs, or seize time-sensitive opportunities.
Cash flow forecasting relies heavily on accurate DPO tracking. Finance teams use historical Accounts Payable Days patterns to predict future cash requirements and plan payment schedules. Companies with consistent DPO can forecast outflows with confidence, while those with volatile payment patterns face uncertainty that complicates budgeting and cash management.
The relationship between DPO and cash conversion cycle determines how long capital will remain locked in operations. Strategic DPO management shortens the cash conversion cycle by delaying payments while speeding up collections. Such a dual approach helps maximize available cash without increasing debt or raising additional capital.
Businesses facing seasonal fluctuations benefit the most from DPO flexibility, as they can extend payment periods during cash-constrained seasons and accelerate payments whenever the cash flow situation improves.
What can Accounts Payable Days tell you about your supplier relationships?
Certain patterns of Accounts Payable Days reveal the health and stability of supplier relationships via payment consistency and timing. Monitoring DPO trends helps identify some early warning signs of relationship deterioration or potential opportunities to strengthen vendor partnerships.
Consistent Accounts Payable Days are an indicator of reliable payment behavior that helps build supplier trust and confidence. Vendors value predictable payments, and companies that stick to agreed-upon schedules often benefit from better service, priority during shortages, and stronger negotiating power. In contrast, sudden increases in DPO can signal relationship strain or financial stress, which suppliers are likely to notice and respond to.
Comparing actual Accounts Payable Days to agreed-upon payment terms shows whether a company honors its commitments. For example, a business with net 45 terms that consistently pays in 60–70 days may be facing cash flow issues or neglecting supplier relationships. Such patterns harm credibility and weaken negotiating power for future agreements.
Comparing your DPO to industry peers can reveal your market position and bargaining power with suppliers. Companies that maintain longer Accounts Payable Days than their competitors typically have one or several of these advantages:
- Stronger negotiating power
- Larger order volumes
- More established relationships
Those with shorter DPO may be newer market entrants, smaller buyers, or businesses that prefer supplier goodwill to cash retention.
How do investors and creditors use Accounts Payable Days to evaluate your business?
Investors and creditors analyze Accounts Payable Days in order to assess financial health, operational efficiency, and management quality. This metric provides extensive insights into cash management practices and potential financial stress that other existing indicators might not reveal.
External stakeholders examine DPO trends, not absolute values. Stable or gradually improving Accounts Payable Days suggest disciplined cash management and healthy supplier relationships. Erratic DPO patterns or sudden extensions raise concerns about liquidity problems, deteriorating vendor relationships, or management struggling with working capital optimization.
Creditors compare a company's DPO to industry benchmarks to evaluate creditworthiness. Accounts Payable Days well above the norm can signal cash constraints and higher default risk, while a DPO below the standard may indicate overly conservative management or missed opportunities to optimize cash flow. Either situation warrants closer scrutiny.
Key signals investors and creditors look for:
- Consistent DPO within industry range
Indicates stable operations and healthy vendor relationships. - Gradual DPO extension with revenue growth
Suggests improving negotiating power and scale advantages. - Sudden DPO spikes
Red flag for potential cash flow crisis or supplier payment difficulties. - DPO declining over time
May indicate loss of market leverage or strategic shift toward supplier preference. - DPO paired with declining margins
Suggests a company may be sacrificing profitability to maintain operations.
Savvy investors look at Accounts Payable Days together with Days Sales Outstanding and Days Inventory Outstanding to get a complete picture of working capital management. Companies that optimize all three metrics show strong financial management skills.

What role do Accounts Payable Days play in working capital optimization?
Accounts Payable Days are a key lever for optimizing working capital, as they allow a company to control when and how much cash is paid to suppliers. The metric makes up one-third of the cash conversion cycle equation, which measures how efficiently a business manages its operating capital.
Working capital optimization requires balancing three interconnected metrics:
- Days Sales Outstanding (collection speed)
- Days Inventory Outstanding (inventory efficiency)
- Days Payable Outstanding (payment timing)
Extending Accounts Payable Days reduces the cash conversion cycle and frees capital for other uses, while maintaining acceptable supplier relationships and operational stability.
The mathematical relationship shows why DPO matters:
Every day added to Accounts Payable Days subtracts one day from the cash conversion cycle, reducing the time capital remains tied up in operations. A company that extends DPO from 40 to 50 days effectively releases 10 days worth of its operating capital.
Strategic working capital management uses Accounts Payable Days adjustments to respond to changing business conditions. During growth phases, extending DPO can fund expansion without external financing. In cash-rich periods, reducing Accounts Payable Days to capture early payment discounts or strengthen supplier relationships may optimize total returns better than maximizing cash retention.
How to calculate Accounts Payable Days: The complete formula
The Days Payable Outstanding formula has three key components that together measure how quickly a company pays its suppliers. Understanding each component is essential for accurate calculation and meaningful interpretation. To calculate DPO correctly, you need to know which figures to use from financial statements, how to adjust for different accounting periods, and which items to include or exclude.
What is the standard DPO formula?
The standard DPO formula calculates the average number of days between receiving supplier invoices and making payment:
- Accounts Payable is the total amount owed to suppliers at a specific point in time, typically found on the balance sheet.
- Cost of Goods Sold (COGS) measures the direct costs of producing goods or services sold during a period, found on the income statement.
- The Number of Days refers to the period being analyzed, most commonly 365 for annual calculations or 90 for quarterly assessments.
For example, a company with $500,000 in accounts payable and $5,000,000 in annual COGS calculates DPO the following way:
This result indicates that the company takes approximately 37 days to pay its suppliers once it has received goods or services. The calculation provides a practical snapshot of payment behavior that can be easily tracked over time and even compared to industry benchmarks.
What does "Accounts Payable" include in the calculation?
Accounts Payable in the DPO formula covers all short-term obligations owed to suppliers and vendors for goods or services that were purchased on credit. The balance sheet account captures invoices that were received but are not paid for yet.
Components that belong in Accounts Payable include:
- Inventory purchases on credit terms
- Raw materials and supplies from vendors
- Contract manufacturing or outsourced production costs
- Services received but not yet paid (consulting, maintenance, utilities)
Items that are excluded from this calculation are:
- Accrued expenses (wages, taxes, interest)
- Notes payable or formal debt instruments
- Long-term liabilities
- Customer deposits or deferred revenue
Using the correct Accounts Payable figure ensures that the DPO calculation reflects actual supplier payment behavior rather than overall liabilities. Many accounting systems separate trade payables from other obligations and make it easy to identify the relevant figure on a standard balance sheet.
How do you determine the Cost of Goods Sold (COGS)?
Cost of Goods Sold, shown on the income statement, represents the direct costs of producing goods or delivering services sold during a specific period. In the DPO formula, COGS serves as the denominator, converting the Accounts Payable balance into a time-based metric.
COGS typically includes:
- Raw materials and components
- Direct labor costs for production
- Manufacturing overhead directly tied to production
- Freight and shipping costs for inventory
COGS excludes operating expenses such as marketing, administrative salaries, office rent, and research and development. These costs are not included because they are not directly tied to goods or services purchased from suppliers on credit.
For service-based businesses without physical inventory, the equivalent measure is usually cost of revenue or cost of services. This figure represents the direct costs of delivering services and functions the same way as COGS in the DPO formula.
Most financial statements clearly label COGS, making it easy to identify. Because companies calculate COGS using consistent accounting standards across reporting periods, it supports reliable and comparable DPO tracking over time.
Should you use beginning, ending, or average accounts payable?
Using average accounts payable provides the most accurate DPO calculation because it smooths out fluctuations during the reporting period. It is calculated as:
Using the average balance helps account for seasonal swings, large one-time purchases, or irregular payment timing that can distort a single point-in-time figure. For example, a company that makes major purchases at the end of the month may show an unusually high accounts payable balance, while a company that processes large payments on the last day of the period may show an unusually low balance.
Ending accounts payable works for internal monthly tracking when simplicity is more important than precision. This approach provides acceptable accuracy for trend monitoring within a single company, but it may also create comparability issues when being benchmarked against other businesses.
Beginning accounts payable rarely appears in DPO calculations because it represents outdated information that doesn’t reflect current payment patterns or obligations.
Most financial analysts and accounting standards prefer using average accounts payable for external reporting and meaningful period-to-period comparisons.
What time period should you use for accurate DPO calculation?
The time period in the DPO formula should match the period covered by the Cost of Goods Sold figure. For example, use 365 days for annual calculations, 90 days for quarterly assessments, and about 30 days for monthly tracking.
Consistency matters a lot more than the specific period chosen for calculation. A company that calculates DPO quarterly should use 90 days in every calculation to allow for meaningful comparison across certain periods. Switching between 365 and 90 days would create artificial changes in DPO that reflect differences in the calculation method rather than actual shifts in payment behavior.
Annual DPO is generally the most stable measure because it smooths out seasonal fluctuations and one-time events. Quarterly or monthly DPO provides more frequent insight into payment trends, but the results must be interpreted carefully to account for normal business cycle variations.
For accuracy, the accounts payable averaging period should match the COGS period. When calculating annual DPO, use the average of beginning-of-year and end-of-year accounts payable along with full-year COGS. For quarterly DPO, use the quarter’s beginning and ending accounts payable together with that quarter’s COGS.
Step-by-step guide: How to calculate your Accounts Payable Days
Calculating Days Payable Outstanding becomes straightforward when you follow a structured process for gathering financial data and applying the formula. This step-by-step guide walks you through the entire process, from locating the required figures to interpreting the final result. Each step explains where to find the information, how to perform the calculation, and what the outcome reveals about your payment practices.
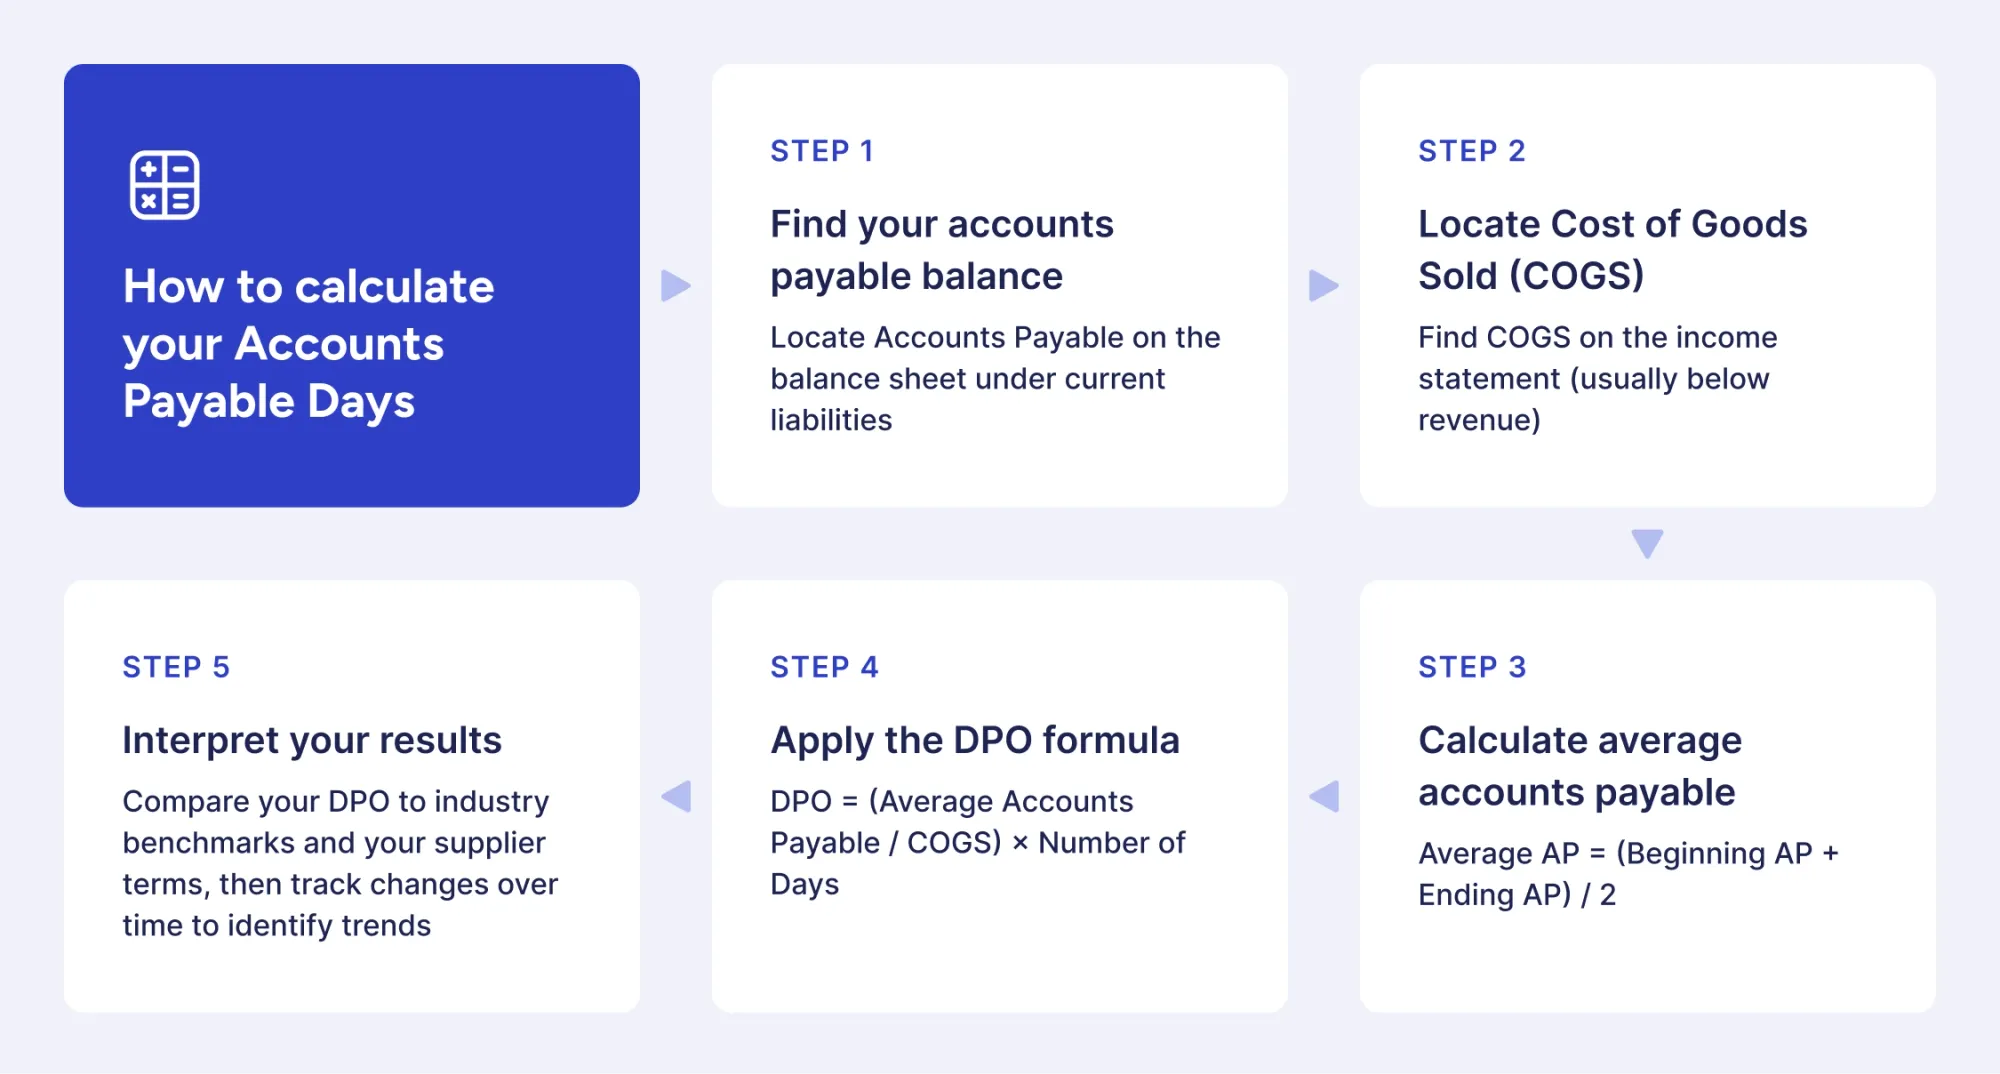
Step 1: Where do you find your accounts payable balance?
Accounts payable is listed on the balance sheet under current liabilities, usually near the top of the liabilities section. Because the balance sheet shows a company’s financial position at a specific point in time, it’s the correct source for accounts payable balances.
Look for line items labeled “Accounts Payable,” “Trade Payables,” or “Accounts Payable – Trade.” In some cases, companies combine related items under “Accounts Payable and Accrued Expenses.” If so, you may need to separate the trade payables portion from accrued expenses such as wages or taxes.
For DPO calculations using average accounts payable, you need two balance sheet dates: the beginning and end of the measurement period. Annual DPO requires fiscal year-end balance sheets from two consecutive years, while quarterly calculations use consecutive fiscal quarter-end balance sheets.
Public companies publish balance sheets in their quarterly 10-Q and annual 10-K filings, which are available through the SEC’s EDGAR database or company investor relations websites. Private companies generate balance sheets through their accounting systems, though accounts payable may sometimes need to be separated from accrued or other liabilities for accurate calculation.
Step 2: How do you locate your COGS on financial statements?
Cost of Goods Sold (COGS) appears on the income statement, usually as the first expense listed after revenue. Because the income statement reports financial performance over a specific period of time, it provides the appropriate COGS figure to match your DPO calculation timeframe.
Look for line items labeled “Cost of Goods Sold,” “Cost of Sales,” or “Cost of Revenue.” Manufacturing companies often break COGS into components such as materials, labor, and overhead. Service businesses may use the terms “Cost of Services” or “Cost of Revenue” instead, but these function the same way in the DPO calculation.
Make sure the COGS period matches the accounts payable period used in your calculation. For annual DPO, use the full-year COGS from the annual income statement. For quarterly DPO, use the COGS reported for that specific quarter. If a company only provides year-to-date figures, you can calculate quarterly COGS by subtracting prior quarters’ results from the year-to-date total.
Step 3: What is the correct way to calculate the average accounts payable?
To calculate the average accounts payable, add the beginning period balance to the ending period balance and divide the result by two:
For example, if accounts payable was $450,000 on January 1 and $550,000 on December 31, the average accounts payable equals:
This averaging method helps smooth out the fluctuations caused by payment timing, large purchases, or seasonal variations that might distort a single point-in-time balance. Companies with relatively stable AP balances throughout the period should show little-to-no difference between average and ending balances.
For monthly or more frequent DPO tracking where speed is much more important than precision, using ending accounts payable should provide an acceptable level of accuracy. With that being said, when it comes to formal financial analysis, external reporting, or benchmarking comparisons, average accounts payable delivers more reliable results that better represent typical payment obligations.
Step 4: How do you apply the Accounts Payable Days formula with your numbers?
To calculate DPO, divide average accounts payable by the Cost of Goods Sold, then multiply the result by the number of days in the period:
Here is a basic example using the following annual figures:
- Beginning Accounts Payable (Jan 1): $450,000
- Ending Accounts Payable (Dec 31): $550,000
- Annual Cost of Goods Sold: $6,000,000
- Period: 365 days
Step-by-step calculation:
- Calculate average AP: ($450,000 + $550,000) / 2 = $500,000
- Divide average AP by COGS: $500,000 / $6,000,000 = 0.0833
- Multiply by days in period: 0.0833 × 365 = 30.4 days
The result indicates that the company takes about 30 days on average to pay its suppliers, meaning invoices are typically settled roughly one month after goods or services are received. This figure provides a useful baseline for comparing the company’s payment practices to industry standards, historical trends, or other performance benchmarks.
Step 5: How do you interpret your final Accounts Payable Days result?
DPO estimates the average number of days a company takes to pay suppliers based on accounts payable and COGS. To interpret the metric correctly, compare it to industry benchmarks, company payment terms, and historical trends rather than evaluating it in isolation.
First, benchmark your DPO against industry norms. For example, a manufacturing company with a 30-day DPO is below the 60–90-day standard, indicating conservative payments or untapped leverage with suppliers. By comparison, a retail company with the same 30-day DPO aligns well with the typical 30–45 day range.
Second, examine your actual payment terms with suppliers. If vendor agreements allow net 45 terms but your DPO calculates to 30 days, you are paying 15 days earlier than required. This result could indicate missed opportunities to retain cash longer and improve liquidity, unless you capture early payment discounts that add financial value.
Third, track DPO changes over time to identify trends. Gradually increasing DPO may signal improving negotiating power, while sudden spikes are a common indicator of issues with the cash flow. Declines could reflect strategic efforts to strengthen supplier relationships or, conversely, reduced payment leverage.
Companies can use the calculated DPO as a starting point for deeper analysis into their existing payment practices, supplier relationship management, and working capital optimization opportunities.
Common Accounts Payable Days calculation mistakes to avoid
Errors in calculating Days Payable Outstanding can seriously distort the results, leading to misleading conclusions about payment performance and cash management. Understanding common mistakes helps ensure your DPO reflects actual supplier payment behavior.
Why using total expenses instead of COGS distorts Accounts Payable Days
Using total operating expenses instead of Cost of Goods Sold inflates the denominator and results in an artificially low DPO. This error occurs because operating expenses include costs that usually don’t generate accounts payable, such as:
- Salaries
- Rent
- Marketing
- Administrative costs
Consider a company with $500,000 in accounts payable, $5,000,000 in COGS, and $8,000,000 in total operating expenses:
Correct calculation: ($500,000 / $5,000,000) × 365 = 36.5 days
Incorrect calculation: ($500,000 / $8,000,000) × 365 = 22.8 days
The incorrect approach understates DPO by nearly 14 days, misrepresenting the company's actual timing of supplier payments. Cost of Goods Sold reflects the inventory and production inputs consumed during the period, making it a practical proxy for supplier-related costs in the DPO calculation.
Always use COGS or cost of revenue from the income statement, not total expenses or operating expenses. That way, you can ensure that your calculation measures supplier payment behavior as accurately as possible.
How inconsistent time periods lead to misleading results
Mixing time periods between the accounts payable balance and COGS figure (or inconsistently applying the “days” multiplier) creates artificial DPO variations instead of real payment trends. This mistake commonly occurs when comparing quarterly and annual figures or switching calculation methodologies in the middle of the analysis.
Using quarterly COGS with annual accounts payable, or applying 365 days in one period and 90 days in another, makes period-to-period comparisons practically pointless. A company tracking DPO quarterly must use quarterly COGS and 90 days consistently, while annual tracking requires only annual COGS and 365 days.
Document your methodology and apply it the same way across all periods. For example, if you calculate Q1 DPO using average quarterly accounts payable and quarterly COGS for a 90-day period, apply the same approach for Q2, Q3, and Q4 to ensure meaningful trend analysis.
Be careful to avoid period mismatches, such as using accounts payable from one fiscal year with COGS from another. Always pair figures from the same reporting period, so your DPO accurately reflects supplier payment behavior for that timeframe.
Why ignoring accruals and one-time payments skews Accounts Payable Days
Including accrued expenses or one-time extraordinary payments in accounts payable can distort DPO by counting obligations that don’t follow normal supplier payment patterns. Accrued expenses (such as wages, taxes, and interest) are listed under current liabilities but have different payment dynamics than trade payables.
Similarly, large one-time purchases can temporarily inflate accounts payable and DPO if not accounted for. For example, a company that makes an unusually large inventory purchase at the end of a period will show a higher AP and DPO that don’t reflect typical payment behavior. This spike can create a misleading DPO increase that usually disappears in the following periods.
When reviewing DPO calculations, make sure that the accounts payable figure includes only trade payables to suppliers for goods and services. Accrued liabilities, notes payable, customer deposits, and other non-trade obligations that follow different payment schedules have to be excluded from these calculations.
For periods that include significant one-time purchases or payments, it’s important to note these extraordinary items when interpreting DPO results. Analysts often adjust calculations to normalize for unusual transactions, especially when comparing performance across different periods or benchmarking against competitors with more consistent purchasing patterns.
When the average accounts payable gives a false signal
Using average accounts payable can sometimes distort DPO for businesses with strong seasonal patterns or concentrated payment periods. In such cases, average AP may not accurately reflect typical payment obligations.
For example, a seasonal retailer with $200,000 in AP in January and $800,000 in December has an average AP of $500,000. While mathematically correct, this average does not represent the company’s payment obligations for most of the year, as it smooths over the significant seasonal fluctuations inherent in the business model.
Companies that process all supplier payments on the last day of the month or quarter may also show deflated AP on balance sheet dates compared to mid-period levels. Relying on these period-end snapshots to calculate the average AP would create results that understate typical payment obligations.
In cases like these, consider using ending accounts payable for simplicity, or calculate the average AP using multiple data points instead of just the beginning and ending balances. For highly seasonal businesses, a monthly average based on all 12 month-end balances provides a more accurate picture than a simple two-point average.
Review accounts payable balances throughout the period to determine whether your averaging method accurately reflects typical payment levels or if adjustments are needed for more precise DPO results.
Accounts Payable Days calculation examples and scenarios
Let’s explore examples of how DPO calculations work across different types of businesses and highlight industry-specific payment patterns. Looking at scenarios from retail, manufacturing, and service sectors demonstrates how operational models and supplier relationships affect Accounts Payable Days. The examples below provide context for interpreting your own DPO results and for benchmarking against similar companies.
What do 45-day Accounts Payable Days look like in practice?
A 45-day DPO means a company takes approximately six and a half weeks to pay suppliers after receiving goods or services. This timeframe represents a moderate payment period that balances cash retention and good supplier relationships.
In practice, suppliers who issue invoices at the beginning of the month typically receive payment around the middle of the following month. For example, a vendor shipping products on January 5 with net 45 terms would usually be paid around February 20. This timing allows the buying company to receive goods, process invoices, and even generate revenue from inventory before paying suppliers.
Companies targeting a 45-day DPO generally negotiate net 45 or net 60 terms with vendors. By paying on schedule, they meet contractual obligations, build supplier trust, and maintain working capital for operational needs.
The cash flow benefit is evident when you compare payment timing with revenue collection. For example, a company that sells goods within 30 days and collects payment within another 30 days (a 60-day total cycle), while paying suppliers in 45 days, keeps cash flowing steadily throughout the process of turning inventory into cash.
How do you calculate Accounts Payable Days for a retail business?
Retail businesses typically show DPO between 30 and 45 days due to fast inventory turnover and frequent supplier replenishment cycles. For example, we can take an abstract mid-sized clothing retailer with the following annual figures:
- Average Accounts Payable: $800,000
- Annual COGS: $8,500,000
- DPO = ($800,000 / $8,500,000) × 365 = 34.4 days
This 34-day payment period reflects proper retail industry dynamics. The company receives merchandise, displays it for sale, and often sells items before paying suppliers. Seasonal variations significantly impact retail DPO, with higher AP during peak purchasing seasons (back-to-school or holiday periods).
Retail businesses strive to find a balance between maintaining inventory availability and managing the cash flow constraints. Large retailers leverage their purchasing volume to negotiate extended terms (up to 60-day DPO). In contrast, smaller retailers tend to maintain a lower DPO to preserve supplier relationships and ensure product availability during more competitive periods.
The rapid inventory turnover in retail naturally pushes companies to maintain moderate DPO. Unlike manufacturers, retailers can’t risk straining supplier relationships, as doing so could disrupt inventory availability or delivery timing during peak sales periods.
What is a typical Accounts Payable Days calculation for a manufacturing company?
Manufacturing companies maintain higher DPO, typically 60 to 90 days, because they purchase raw materials in bulk and establish long-term supplier partnerships. Consider an industrial equipment manufacturer with an average accounts payable of $2,400,000 and an annual COGS of $12,000,000. We can calculate its DPO as:
This 73-day payment period aligns well with the manufacturing industry standards we have covered before. The extended timeframe reflects several industry-related factors:
- Bulk purchasing agreements with volume discounts
- Established relationships with key suppliers
- Production cycles that convert raw materials into finished goods over weeks or months
Manufacturers often benefit from strong negotiating leverage that comes from their large and predictable order volumes. Suppliers gladly accept longer payment terms in exchange for stable, high-volume contracts that are easy to justify in their own capacity planning and investment. A mutual dependency like that creates payment structures that optimize cash flow for manufacturers without negatively influencing the reliability of the supply chain.
Additionally, raw materials are often purchased months before finished goods are delivered to customers, making a longer DPO crucial for managing working capital. For example, a manufacturer that buys steel in January, produces equipment in February and March, and ships it in April needs a cash flow buffer that 60–90 day payment terms provide.
How do Accounts Payable Days calculations differ for service-based businesses?
Service businesses typically show a lower DPO (around 20 to 35 days) because they purchase fewer physical goods and maintain smaller accounts payable balances. Here’s an example of a consulting company with the following inputs:
- Average Accounts Payable: $150,000
- Annual Cost of Services: $2,000,000
- DPO = ($150,000 / $2,000,000) × 365 = 27.4 days
A 27-day payment period is typical for a service business with minimal inventory and shorter credit terms. Their purchases usually consist of office supplies, software subscriptions, or professional services rather than physical goods for resale. Service companies often pay for items that are used immediately and don’t need to be held in inventory before generating revenue.
Service businesses use Cost of Services or Cost of Revenue instead of traditional COGS in the DPO formula. This figure captures direct costs, such as subcontractor payments, third-party services, and materials consumed in service delivery, creating the accounts payable obligations that DPO measures.
Lower DPO in service sectors isn’t an indication of poor cash management, but it does reflect a different operational model. Service companies generate revenue primarily from labor and expertise rather than purchased inventory, which naturally results in smaller payables (relative to total revenue) and faster payment cycles with the limited supplier base they maintain.
How does DPO relate to the cash conversion cycle?
Days Payable Outstanding (DPO) is a key part of the cash conversion cycle, which measures how long a company’s capital stays tied up in operations. The cycle combines DPO with receivables and inventory metrics to show overall working capital efficiency.
Analyzing DPO within this context highlights how payment timing affects financial performance and identifies opportunities to improve cash flow without needing extra financing or higher revenue.
What is the cash conversion cycle, and why does it matter?
The cash conversion cycle reveals the number of days between paying suppliers and collecting cash from customers. The formula combines three metrics:
A shorter cycle means capital moves through operations faster, reducing financing needs and improving liquidity. There are also companies with negative cash conversion cycles that collect customer payments before paying suppliers, creating a self-financing business model that generates cash rather than consuming it.
The metric matters because it directly impacts how much working capital a business needs to maintain its operations. A 60-day cycle requires substantially more cash on hand than a 20-day cycle to fund the same revenue level.
How do DPO, DSO, and DIO work together?
The three metrics work in opposition to produce the final cash conversion cycle number. Days Sales Outstanding and Days Inventory Outstanding increase the total cycle length by extending the time before cash arrives, while Days Payable Outstanding decreases that same cycle by deferring cash outflows.
Increasing DPO by 10 days has the same mathematical impact on the cash conversion cycle as reducing DSO or DIO by 10 days. However, each lever involves different trade-offs and difficulty levels. Extending payment terms requires supplier cooperation, accelerating collections depends on customer agreement, and reducing inventory levels risks stockouts.
Balancing these metrics creates multiple strategic options. A company may accept higher DIO to keep products available while offsetting it with longer DPO and faster collections. Another business might keep DPO low to maintain strong supplier relationships while shortening the cycle through lean inventory and quick customer payments.
Track all three metrics together to avoid improving one area at the expense of overall working capital performance.
What happens when you optimize all three metrics?
Optimizing all three metrics at the same time minimizes the cash conversion cycle while maximizing the efficiency of working capital. However, this approach requires a lot of coordination across procurement, sales, and operations.
Top-performing companies optimize working capital by negotiating longer payment terms with suppliers, offering early payment discounts to prompt-paying customers, and keeping inventory lean through efficient supply chain management. This balanced approach builds a sustainable competitive advantage and stronger cash flow.
However, trade-offs exist: extended DPO can strain supplier relationships, aggressive collections may trigger customer resistance, and minimal inventory raises operational risk. Effective optimization finds the point where further cycle reduction no longer justifies added risks or relationship costs.
Companies that optimize effectively would be able to fund their own growth internally, reducing dependence on external financing and maintaining financial flexibility for situations like acquisitions or market downturns.
How can you use DPO to shorten your cash conversion cycle?
DPO is the most controllable component of the cash conversion cycle since payment timing lies entirely within the discretion of the management. Unlike collections or inventory turnover, which depend on customer behavior and market demand, companies directly control when they pay suppliers.
Extending DPO from 30 to 45 days reduces the cash conversion cycle by 15 days without the need for operational changes or external cooperation. It immediately frees working capital equal to 15 days of Cost of Services.
Helpful practical strategies include:
- Renegotiating payment terms with key suppliers
- Consolidating purchases to gain volume leverage
- Timing payments to maximize the use of available credit periods without exceeding agreed terms
A company reviewing vendor contracts might discover opportunities to shift from net 30 to net 45 terms simply by asking, especially if order volumes have grown since the original agreements.
Review the cash conversion cycle each quarter and use DPO adjustments as the main tool to improve it, while maintaining strong supplier relationships and stable operations.
Accounts Payable Days vs. other payables and liquidity metrics
Days Payable Outstanding measures payment timing, while other financial metrics evaluate liquidity capacity and overall financial health. Distinguishing between these metrics helps determine which tool provides the most relevant insights for specific business questions.
DPO vs. other payables metrics
The Payables Turnover Ratio shows how many times a company pays off its accounts payable during a year. It is calculated as:
COGS / Average Accounts Payable
This metric is inversely related to DPO when expressed in days. For example, a Payables Turnover Ratio of 12 corresponds to roughly a 30-day DPO (365 ÷ 12). While the two are mathematically equivalent, expressing payment timing as DPO in days is usually easier to interpret than using turnover frequency.
Accounts Payable to Sales Ratio compares payables to revenue rather than COGS, showing what percentage of sales remains unpaid to suppliers. This metric serves different purposes than DPO, focusing on the relationship between liabilities and top-line performance rather than payment timing patterns.
DPO vs. liquidity metrics
Current Ratio and Quick Ratio measure the ability to pay obligations, while DPO measures when companies choose to pay. A business with a strong 2.5 current ratio might maintain 75-day DPO through strategic choice rather than financial necessity. Liquidity ratios answer the question "Can we pay?" while DPO answers "When do we pay?"
Cash Ratio and Operating Cash Flow Ratio assess immediate liquidity using only cash and equivalents. These metrics reveal financial flexibility independent of payment timing, while DPO specifically tracks supplier payment behavior.
Selecting the right metric
Choose the metric that matches the question you’re trying to answer:
- DPO: Use when analyzing supplier payment timing or optimizing the cash conversion cycle.
- Liquidity ratios: Use when evaluating a company’s ability to meet obligations or its overall financial stability.
- Payables turnover: Use when comparing payment performance across companies or other turnover-based metrics to ensure consistency in analysis.
What factors affect your Days Payable Outstanding?
Multiple internal and external factors influence Days Payable Outstanding, from negotiated supplier agreements to company financial position. Recognizing these drivers helps distinguish between strategic DPO management and constraints imposed by business circumstances.
How do payment terms with suppliers impact your DPO?
Negotiated payment terms establish the upper boundary for DPO by defining when payments become due. A company with net 30 terms faces supplier expectations of payment within 30 days, making a 60-day DPO difficult to sustain without severe damage to relationships or late fees.
Supplier agreements also vary widely depending on industry norms, order volumes, and relationship history. Standard terms range from net 10 for small purchases to net 90 for large manufacturing contracts. Companies with multiple suppliers often have to maintain different terms with each vendor, which creates a “blended” DPO that only represents the weighted average of all payment agreements.
Renegotiating terms is the most direct path to extending DPO. A business that increases order volumes or demonstrates a reliable payment history can often secure longer terms. For example, moving from net 30 to net 45 increases sustainable DPO by 15 days without any changes to operations.
What role does your company's cash position play?
Cash position determines whether extended DPO reflects strategic choice or financial necessity. Companies with strong cash reserves deliberately extend their payment periods to optimize working capital, while cash-constrained companies often delay payments because they can’t pay earlier.
Cash-rich businesses maintain flexibility in payment timing to maximize value. They may pay early to capture discounts when the savings outweigh the cost of using cash, or delay payments to the full term when holding cash offers greater strategic benefit. This flexibility provides a strong competitive advantage in managing both supplier relationships and working capital.
Cash-constrained companies lose this flexibility and may extend DPO beyond agreed terms out of necessity. Such forced delays signal financial stress to suppliers and creditors, which can lead to stricter credit terms or supply restrictions, worsening the company’s cash situation.
How do early payment discounts affect DPO decisions?
Early payment discounts create financial incentives to reduce DPO by offering percentage reductions for accelerated payment. Standard terms like 2/10 net 30 offer a 2% discount for payment within 10 days instead of the full 30-day term, representing an annualized return of approximately 36%.
This simple return calculation that we presented earlier makes most early payment discounts financially compelling. A company forgoing the 2% discount to use cash for 20 additional days effectively pays 36% annually for that short-term financing, greatly exceeding most borrowing costs and alternative investment returns. Lower DPO is typically justified when it comes to capturing these discounts, despite the reduction in cash retention.
The decision is less straightforward when weighing early payment discounts against working capital needs. A fast-growing company may choose to forgo discounts to preserve cash for inventory growth or operational expansion, effectively treating the lost discount as a cheaper alternative to external financing or equity dilution. Each business must assess discount opportunities in light of its own capital requirements and opportunity costs.
What impact does seasonality have on your DPO?
Seasonal businesses see DPO fluctuate throughout the year as purchasing patterns follow demand cycles. Retailers often buy extra inventory before peak seasons, temporarily increasing accounts payable and extending DPO even if payment practices remain unchanged.
For example, a toy retailer may maintain a 35-day DPO most of the year but see it rise to 50–60 days in October and November due to holiday inventory purchases. These spikes don’t indicate a change in payment behavior. They reflect the timing mismatch between large purchases and payment dates under standard terms.
When analyzing DPO for seasonal companies, it’s more meaningful to compare the same periods year-over-year rather than quarter-to-quarter. Comparing Q4 this year to Q4 last year provides real insight, while comparing Q4 to Q1 may show artificial variations driven solely by seasonal patterns, not by actual changes in payment practices or financial health.
How does company size influence typical DPO ranges?
Larger companies typically maintain higher DPO due to greater negotiating leverage with suppliers. Major corporations placing multi-million dollar orders can easily demand extended payment terms that smaller competitors can’t access.
This size advantage stems from the sheer value that large buyers represent to suppliers. Vendors grant longer payment terms to major customers since losing their business would heavily impact revenue and operations. This volume-based leverage lets large companies extend DPO and optimize working capital without harming supplier relationships.
Small and mid-sized businesses face the opposite challenge: they often must pay faster to ensure reliable access to suppliers and signal financial stability. For example, a small manufacturer may have a 30–35 day DPO, while a large competitor in the same industry maintains 70–80 days. This gap reflects differences in negotiating power, not necessarily superior cash management or financial strength.
How can you improve your accounts payable days?
Improving Days Payable Outstanding requires strategic negotiation, efficient processes, and clear visibility into payment operations. Companies that actively manage payables can extend DPO, preserve strong supplier relationships, and take advantage of available discounts.
The most effective improvements come from analyzing current payment patterns, spotting optimization opportunities, and using systems that provide real-time insight into accounts payable and upcoming obligations.
How tools like Precoro improve visibility into payables?
Accounts payable automation tools provide full visibility into payment obligations, supplier terms, and spending patterns that manual processes often hide. Real-time dashboards display upcoming payment dates, outstanding invoices, and available early payment discounts, allowing finance teams to plan payments strategically instead of simply reacting to due dates.
Precoro is a procurement centralization and automation platform that delivers several key capabilities:
- AI-powered invoice capture with OCR: Precoro’s OCR technology uses AI to extract data from your AP inbox and accurately prefill invoices. All your team needs to do is approve the ready-made document.
- Centralized invoice management: Consolidates purchase orders, document approvals, and invoice reconciliation in a single system.
- Supplier Portal: Lets vendors submit invoices directly through a dedicated Supplier Portal, track document status, and communicate with your team in one place.
- Spending analytics: Reveals patterns in supplier spending to inform negotiation strategies and identify consolidation opportunities.
- Three-way matching: Automatically compares purchase orders, receiving documents, and invoices to identify fraud, spot duplicates, and prevent payment errors.
Better visibility improves supplier relationships by minimizing payment errors and ensuring predictable, on-time payments. Companies using procurement automation can manage DPO more effectively, maintain vendor trust, and take advantage of discounts that manual processes often overlook.
Frequently asked questions about Days Payable Outstanding
Yes, companies can extend DPO through transparent communication and gradual term renegotiation rather than unilateral payment delays. Approach key suppliers with proposals for extended terms based on increased order volumes, consistent payment history, or strategic partnership benefits that justify longer payment windows. Sudden extensions without discussion damage relationships, but negotiated term changes that suppliers agree to maintain trust while improving working capital.
Currency fluctuations can distort DPO if Accounts Payable and COGS are converted using different exchange rates. For example, if payables use the invoice-date rate but COGS reflects another rate, DPO may shift due to currency movements rather than payment behavior. To maintain accuracy, use a consistent conversion date (typically the invoice date) for both figures. Companies with significant international purchasing may also track DPO by currency or region to reveal clearer trends.
Negative DPO can occur in theory if a company prepays suppliers before receiving goods or services, but this situation is rare in normal business operations. It typically happens only in specific cases, such as advance payments for custom manufacturing or deposits on large capital equipment orders. In standard trade credit transactions, negative DPO isn’t possible because accounts payable arises only after goods or services are received, which makes DPO inherently positive.
Ready to improve payment visibility and optimize DPO? Book a Precoro demo and see how automation can simplify your accounts payable operations.


)