
33 min read
Accounts Payable Forecasting: The Missing Link in Financial Planning
Make tomorrow’s AP decisions now. Learn why accounts payable forecasting fails, key models, and find the right fit for your company.
Cash has always been expensive. Today, its price is higher than ever, not in physical currency, but in the opportunity cost of using it at the wrong time. As interest rates fluctuate, there’s very little benefit to keeping money idle. The same goes for a lack of payment foresight: companies either have to borrow to cover unexpected expenses or miss opportunities to put those funds to better use.
Accounts payable forecasting is at the heart of this realization as 70–75% of total spend at Fortune 500 and FTSE 350 companies is ultimately paid to external suppliers. Supplier payments are one of the largest cash levers most companies control directly, yet they’re also one of the least predictable. After all, a single approval delay can shift the entire payment schedule. A data-driven forecast accounts for the operational realities of payables and provides teams with a more reliable basis for financial decisions.
Read on to find out:
What is accounts payable forecasting?
What is the difference between AP forecasting and cash flow forecasting?
What is the difference between AP forecasting and AR forecasting?
What are the benefits of accounts payable forecasting?
Why are your AP forecasts inaccurate?
Accounts payable forecasting formulas and models
Which accounts payable forecasting model fits your company best?
How to forecast accounts payable: A step-by-step roadmap
FAQ about accounts payable forecasting
How AP automation with Precoro makes forecasts foolproof
What is accounts payable forecasting?
AP forecasting is the process of predicting the timing and amounts of payments to suppliers. Its biggest value lies in timing: you can monitor when payments will be made, so the company knows to expect these expenses and can budget accordingly.
An accounts payable forecast typically considers the following signals:
- Invoice status: Invoices received, approved, or on hold.
- Payment timing: Any factors that influence when the payment goes out to the vendor, including payment terms (e.g., Net 14, Net 30, Net 45), payment run dates, and approval workflows.
- Expected liabilities: Approved purchase orders, goods received but not yet invoiced (GRNI), and services already delivered but not yet billed.
What is the difference between AP forecasting and cash flow forecasting?
Accounts payable and cash flow forecasting are closely related. In fact, AP forecasting sits within the broader cash flow forecasting process. They mainly differ in the level of detail.
Cash flow forecasting looks at the entire picture over a specific period, meaning all expected money coming into and out of the business. It combines receivables, payables, payroll, taxes, debt payments, and other cash movements to show whether the company can safely meet its obligations.
AP forecasting, on the other hand, focuses on one specific part of that picture: when supplier payments will actually be made and how much cash they’ll require. In essence, the data from the accounts payable forecast is often used in the payables section of the broader cash flow forecast.
What is the difference between AP forecasting and AR forecasting?
Payable and receivable forecasting addresses the opposite sides of cash flow and serves different purposes for the business.
Accounts payable forecasting focuses on cash outflow, specifically money owed to suppliers for goods and services. It estimates when these payments will be made and how much funding they’ll require. The forecast outcome can be controlled internally: the company’s AP team can influence when payments occur within agreed terms.
Accounts receivable forecasting focuses on cash inflow, money owed to the company by customers who purchased goods or services from it. It predicts when customers will pay, based on invoices issued, credit terms, and expected delays. Unlike AP, AR timing depends heavily on customer behavior, which you can influence but not strictly control. Customers may pay early or late, and any disputes might disrupt the forecast.
Despite their differences, both functions are worth forecasting. Payables forecast helps protect vendor relationships and generally budget for future expenses. Receivables give the company an estimate of how much income it can expect.
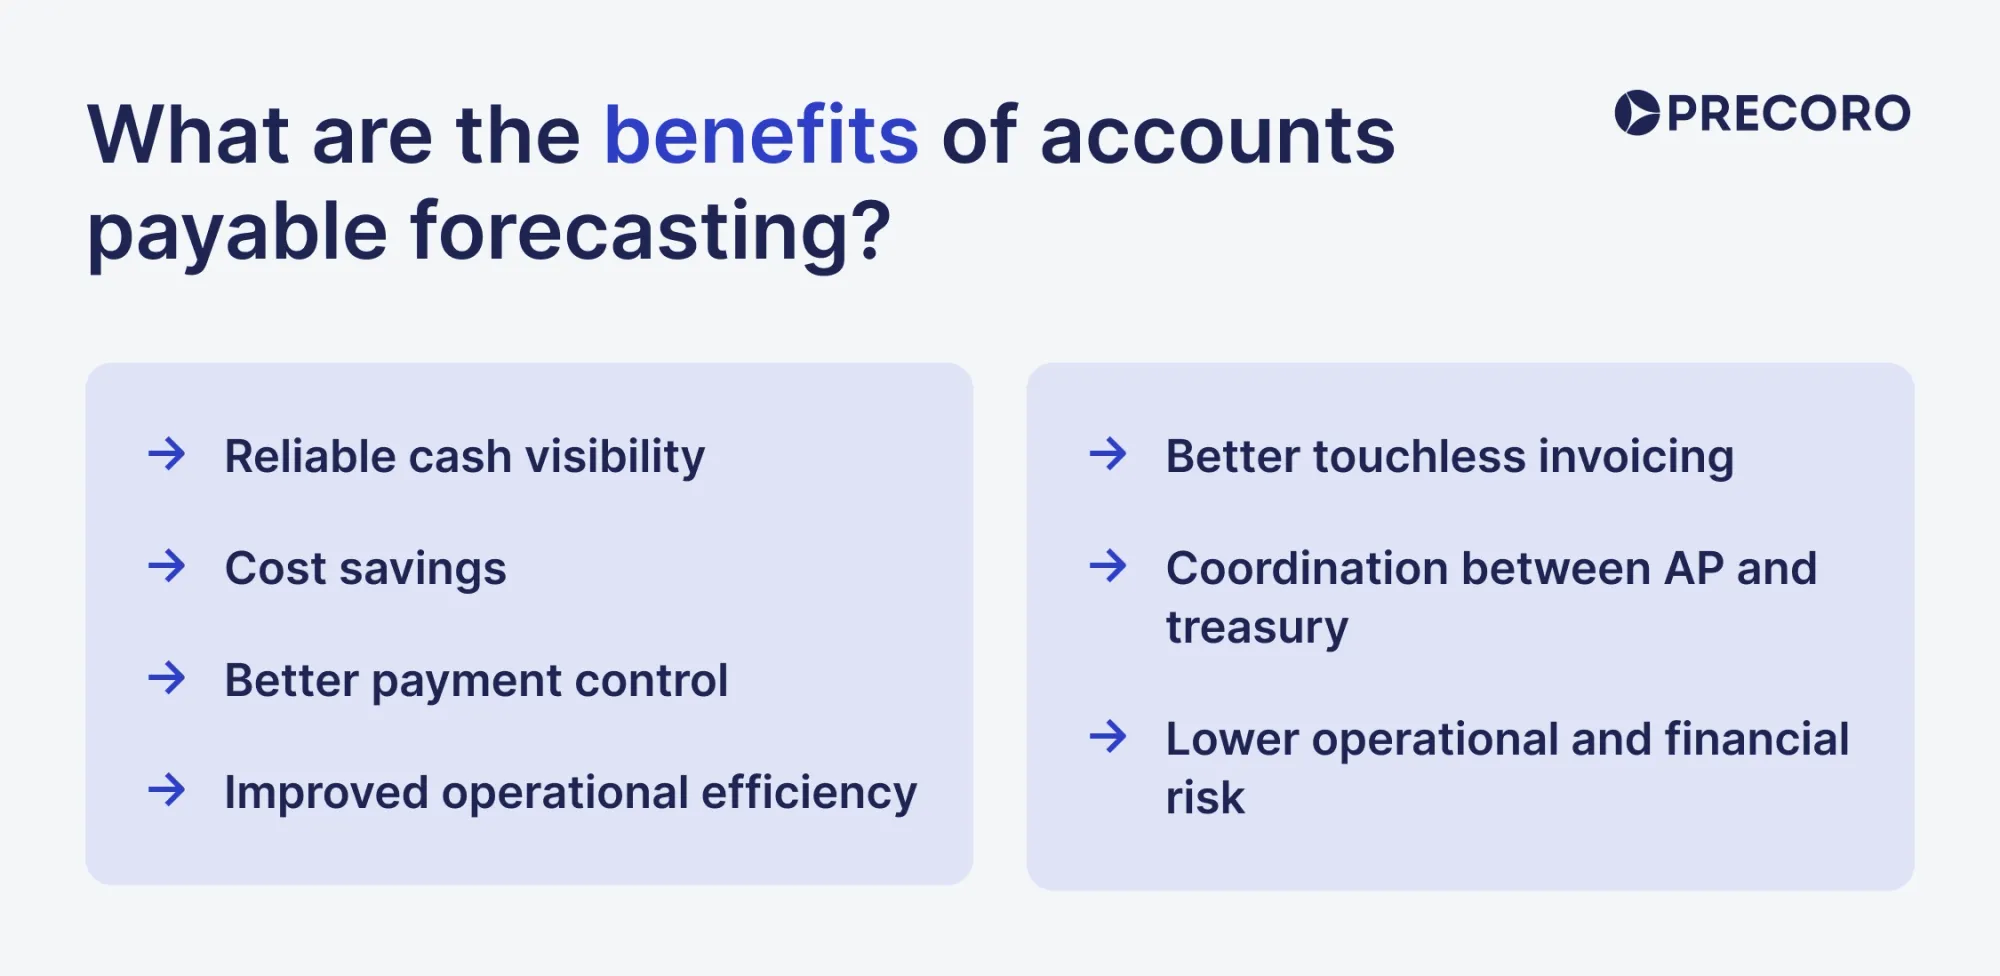
What are the benefits of accounts payable forecasting?
Predicting payables comes with more advantages than just the knowledge of how much and when you owe. Learn in which areas, besides payment timing, accounts payable forecasting pays off.
Reliable cash visibility
Knowing when the business has to pay gives teams a much clearer view of what they actually spend. Too often, companies rely on averages from prior month-end reports and keep a money buffer just in case. In contrast, the AP forecast provides a detailed breakdown of when, how much, and to whom the company is likely to pay.
When teams forecast accounts payable, they regain control over their working capital. You predict how much you’ll spend and redirect the money you’ve previously kept as a buffer towards specific goals. These funds are budgeted for and won’t be accidentally used on ad hoc purchases.
Cost savings
Forecasting can also help reduce costs by avoiding late fees or identifying the best opportunity for an early-payment discount. Again, it puts your team back in control: instead of relying solely on renegotiation, you can improve liquidity with the available resources. The money doesn’t sit idle, and the team’s decisions are proactive: you predict ahead of time and have a contingency plan even when conditions change.
Better payment control
With accurate predictions of payables, the AP team no longer simply reacts to payments as they come. They develop a plan of action and decide when to pay within the terms and policy, rather than rushing at the last minute. Such an approach helps prioritize critical suppliers, align payments with cash availability, and avoid unnecessary early or late fees.
Improved operational efficiency
By itself, forecasting doesn’t impact daily operations. However, it forces discipline in AP processes. A usable forecast requires accurate, preferably centralized data, timely invoice capture, and a record of any exceptions. Companies simply need to develop new policies that require accurate data collection and an organized invoice workflow. These changes offer their own benefits, including reduced manual work and improved data visibility.
Better touchless invoicing
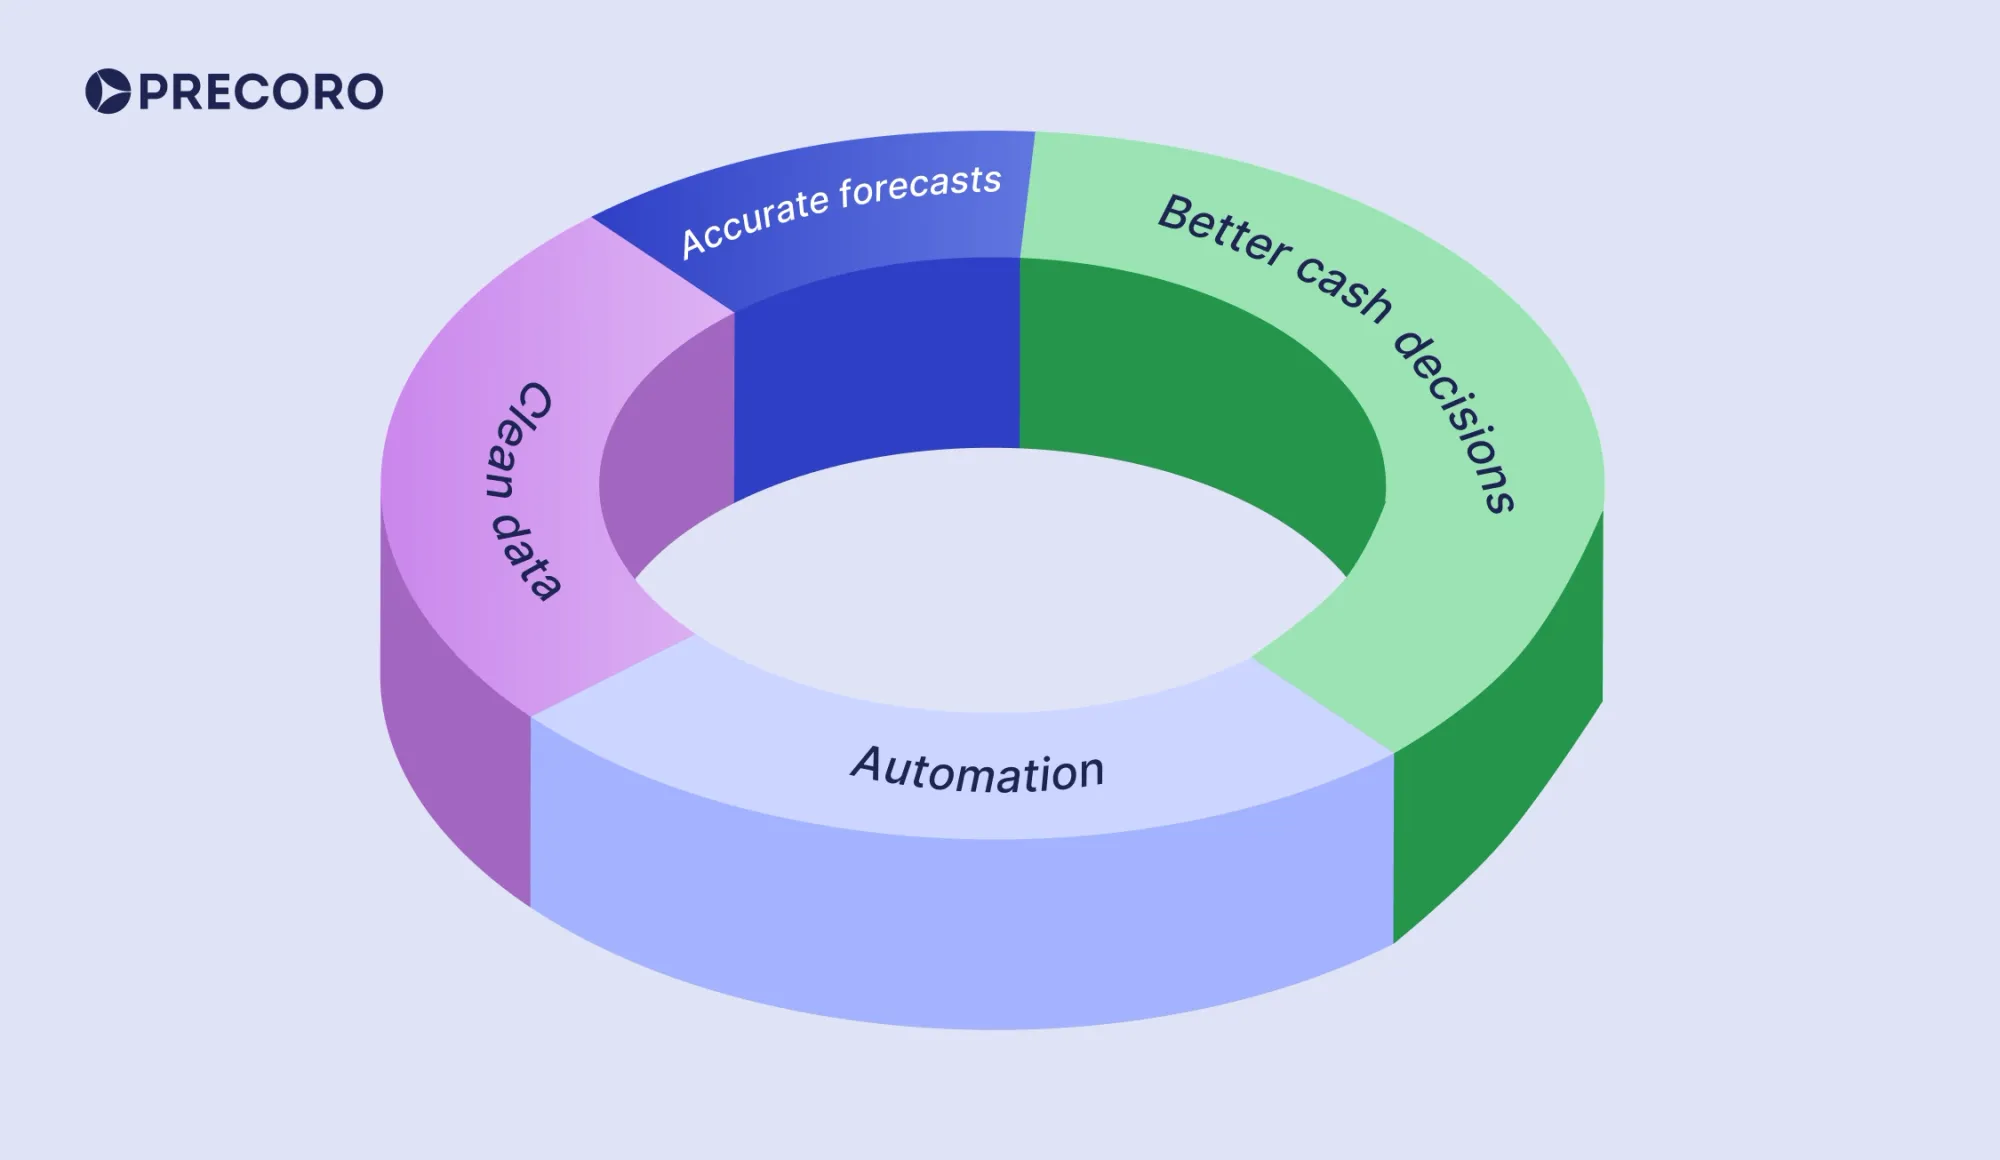
Good AP forecasts rely on structured data, which is best achieved with automation. 73% of teams already use AI in accounts payable for this exact reason. Automation and forecasting work in tandem and essentially reinforce each other. When invoices are processed through a consistent, automated workflow, you get reliable, accurate data. In turn, the higher the data quality, the more precise the forecast.
As automation increases, predictions improve, and better forecasts support further automation. You end up with a feedback loop: automation improves data quality, cleaner data sharpens forecasts, better forecasts drive stronger decisions, and those decisions create even more incentive to automate.
Coordination between AP and treasury
Accounts payable forecasting is at its most valuable when it actively informs financial decisions. Treasury, which is responsible for liquidity and company assets, relies on accurate forecasts to time payments, sequence disbursements, and assess the need for additional funding.
With 65% of AP teams now directly involved in cash management, the payables function has moved beyond invoice processing. It provides the treasury with insights into upcoming supplier payments, which, in turn, maintains the company’s financial stability.
Lower operational and financial risk
Unplanned payments put a lot at stake. A single late or missed invoice can easily strain supplier relationships or lead to careless decisions made under pressure. By identifying upcoming payments in advance, a data-driven AP forecast gives teams time to fix delays or exceptions before they cause problems.
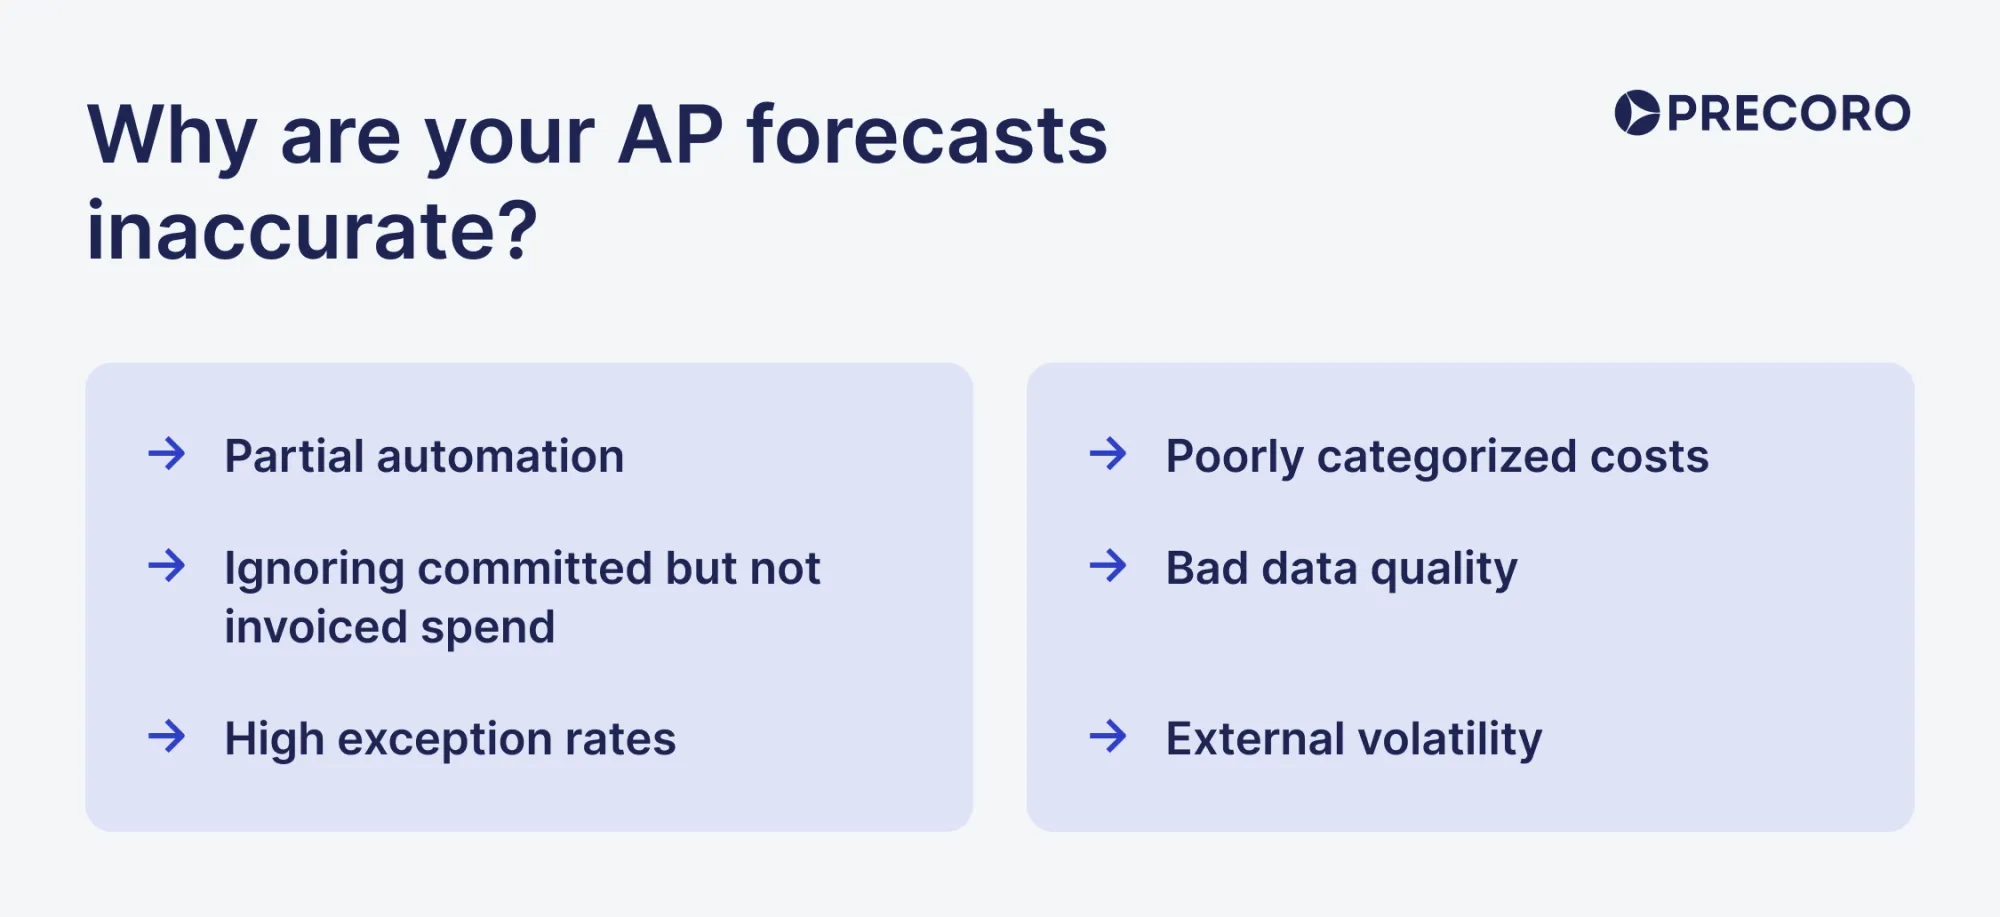
Why are your AP forecasts inaccurate?
If you’ve noticed inconsistencies in your accounts payable forecasts, consider what’s happening externally, in the market you’re operating in. If no major external shocks are affecting your business, look inward: at the data included, the overall process, and the visibility given to teams. Here are the most common reasons AP forecasts fail to line up with reality.
-
Partial automation
Full automation isn’t the norm yet, with 74% of AP teams automating only some functions, not the entire process. Forecasts rely on timely, consistent data, so manual inputs in one place and automation in another can quickly erode that consistency. Invoices processed outside the system or manual workarounds create blind spots that even a good forecasting model can’t compensate for.
-
Ignoring committed but not invoiced spend
Many teams estimate based only on invoices already received, especially in short-term forecasts. That approach leaves out purchase orders, goods received but not invoiced, and recurring charges that have already been negotiated. Ignoring these obligations won’t make them go away—they’ll still resurface, but the team might not budget for them. It’s a simple trap that might cost you thousands in overruns once invoices actually arrive.
-
High exception rates
Invoice exceptions are cited by 53% of AP professionals as one of their biggest challenges. In addition to draining the company’s time and resources that could be used more strategically, they also affect accounts payable forecasting. For instance, when the team has to spend hours on invoice issues, some errors can slip through, making forecasts seem more optimistic than they actually are. If the same issues reappear during the invoicing or payment procedure and aren’t fixed, your forecast is essentially unreliable.
-
Poorly categorized costs
Improper category management can skew the forecast. Most companies plan their spend around category-level budgets, each owned by a specific team or manager. If an office supply purchase is mistakenly filed under equipment, it bypasses the expected budget and approval workflow. The error often isn’t noticed until after payment, when the wrong budget shows an overrun and the forecast suddenly looks inaccurate.
-
Bad data quality
Data errors are also a major issue for AP teams, with 53% listing them as a key challenge. Not only do these errors delay approvals and force teams to work twice to rectify them, but they also directly affect forecast accuracy.
For example, if the due date is entered incorrectly, the payment may be included in the later period of the forecast, even though the invoice should be paid sooner. Errors in amounts create an entirely different set of problems: they can resurface later as unexpected budget overruns.
If this happens often, AI-powered OCR tools can take a lot of the pressure off the team. Precoro, for example, uses Google AI to understand invoice layouts, extract relevant details, and automatically populate the correct fields. The system gives you clean, structured data from the start, which you can use to build an accurate forecast.

-
External volatility
Some factors are simply outside of your team’s control. Supply chain disruptions, price swings, or sudden spikes in demand can all change purchasing and payment behavior. Knowing how to forecast accounts payable in a turbulent geopolitical climate is a skill of its own. In such volatile conditions, you might need to update forecasts more frequently and add a margin of error to account for these situations.
Accounts payable forecasting formulas and models
Accounts payable forecasting uses different formulas and models depending on how far ahead you’re planning. Short-term forecasts primarily focus on individual invoices, while long-term forecasts rely on historical patterns and strategic decisions. Mid-term predictions straddle the line between the two and combine invoice-level detail with a strategic outlook over the coming months.
Short-term forecasting models
Timeframe: 0-30 days
Goal: Plan upcoming payments and their timing.
Short-term forecasting satisfies operational objectives. It’s the closest to the execution part of the job and is primarily transaction-driven. Here, you don’t create a grand strategy to save costs or negotiate a better deal. The entire point is to estimate payment patterns, how much you’ll have to pay, and to budget for that money.
These models are often maintained manually in an accounts payable forecast template in Excel, especially in smaller teams. Key methods you can use to predict payables in the near future include AP aging analysis and weekly or bi-weekly payment schedules.
AP aging report
An AP aging report groups supplier invoices by the length of time they’ve been unpaid. It’s a relatively quick way to see which transactions require immediate attention and which can be deprioritized. The common practice is to separate invoices in the report into several time ranges:
- Current: Billed invoices that aren’t overdue.
- 1–30 days past due: Invoices that are overdue by up to 30 days.
- 31–60 days past due: Invoices overdue by 31–60 days, often delayed due to exceptions or approval issues.
- 61–90 days past due: Invoices overdue by 61–90 days, with risk of supply disruptions or penalties.
- 90+ days past due: Invoices overdue by more than 90 days, potentially straining vendor relationships.
Below is an example of how to forecast accounts payable with an AP aging report.
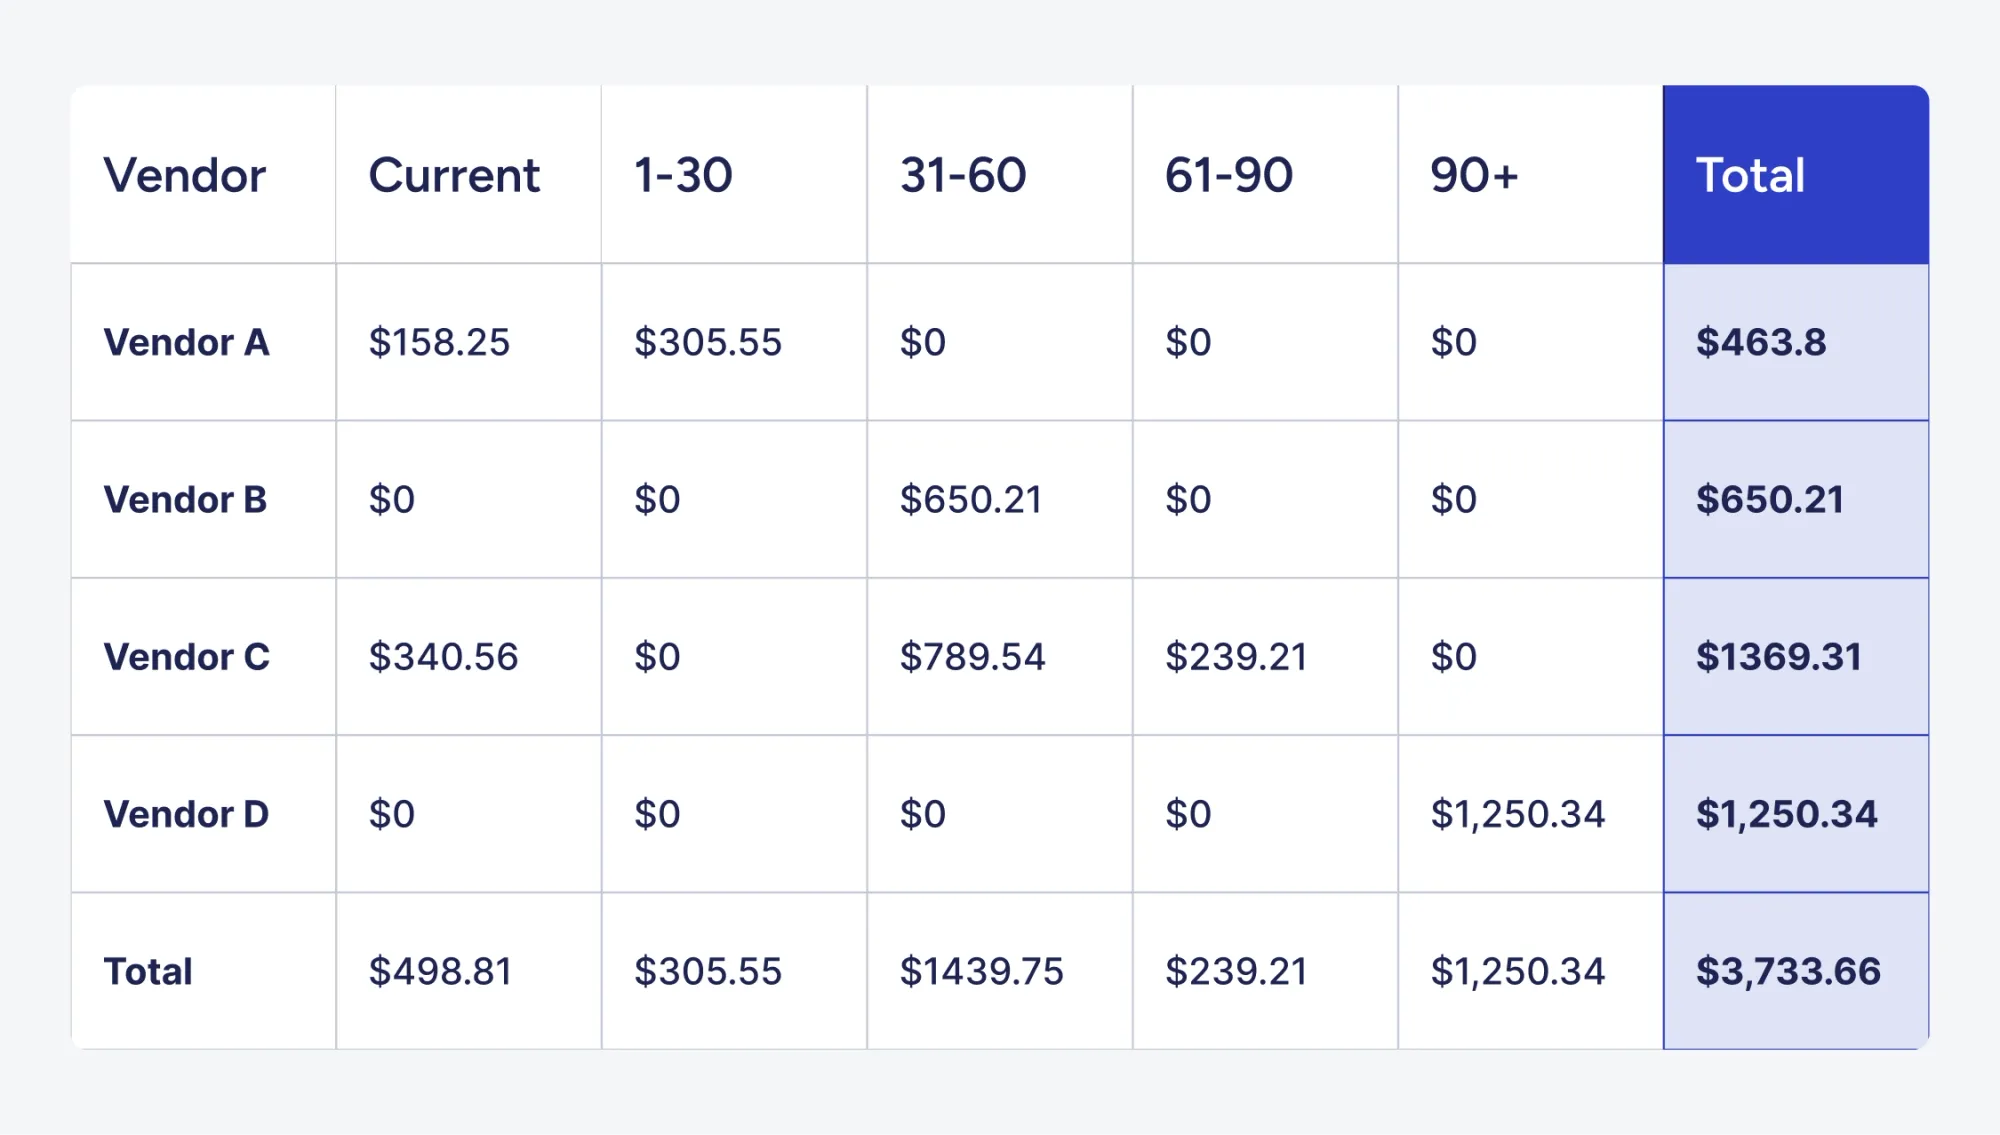
The example paints an alarming picture. Vendor A is the only one with invoices still within the Current and 1-30 days ranges. Vendor B’s invoices either weren’t approved in time or were missed during the last scheduled payment runs.
The dynamic in Vendor C’s row points to potential approval delays. The fact that Vendor D’s balance is only stuck in the 90+ range suggests there may be a dispute or an invoice that no one is actively pushing through.
Best use case: Teams can identify overdue invoices and decide which payments need immediate action.
Not designed for: Prediction of payments beyond the near future or new invoice submissions.
Weekly or bi-weekly payment schedules
Payment schedules help link supplier payments to the company’s disbursement cycle, during which the AP team processes invoices in batches on a predetermined date. Although generally considered a planning tool, this method helps assess and decide when suppliers will actually be paid. It considers approval statuses, exceptions, and payment runs.
Best use case: Planning invoice processing alongside payment runs.
Not designed for: Long-term planning, forecasting for non-committed purchases.
Mid-term models
Timeframe: 4 weeks to 12 months.
Goal: Anticipate future payments before invoices.
Medium-term methods factor in both invoices already in the system and those likely to arrive. Since the time horizon is significantly longer, the forecast now accounts for more variables. Besides internal factors like approval delays and payment schedules, teams factor in seasonality and the impact of AP on the broader cash flow budget.
To forecast accounts payable during this period, you can use a 13-week forecast, cash flow budgeting, and seasonality adjustments.
13-week rolling forecast
A 13-week forecast is a practical way to see supplier payments week by week for roughly the next three months. The forecast is initially built based on the weekly or bi-weekly payment schedules. The team lists outstanding invoices, upcoming payment dates, and expected expenses. As the next week rolls around, you replace last week’s estimate with what was actually paid and push delayed items to the following week.
Best use case: Short-term visibility into supplier payments across the next quarter.
Not designed for: Annual planning.
Cash flow budgeting
Cash flow budgeting includes accounts payable as part of a monthly or quarterly plan, alongside payroll and revenue. The purpose is to see how all expected cash inflows and outflows affect the company’s balance sheet.
Instead of trying to predict the exact payment date of every invoice, teams start from the spend planned in the P&L statement. They then estimate when that spend will turn into cash payments using payment terms and average delays (for example, how long the company usually takes to pay suppliers).
Teams follow a similar approach to the 13-week forecast. Each month or quarter, they replace estimates with actual results and update assumptions, so the forecast stays relevant without starting from scratch.
Best use case: Monthly-quarterly planning and alignment of AP with cash flow.
Not designed for: Weekly payment planning.
Seasonality adjustments
Many companies buy more ahead of the holiday season or ramp up purchases before a major project, especially in construction and manufacturing. Seasonality adjustments use historical monthly or weekly patterns to adjust expected payables during periods of demand spikes or drops.
Teams usually review the last 12–24 months to identify above- or below-average patterns, then apply them in future forecasts. In most cases, simple month-by-month adjustments based on past behavior are enough to improve accuracy.
Best use case: Mid-term planning in businesses with stable, repeatable seasonality.
Not designed for: Companies that rely on highly irregular purchasing or major one-off events.
Long-term models
Timeframe: 12 months and beyond
Goal: Understand how accounts payable will evolve as the business grows.
After the one-year mark, accounts payable forecasting grows into more of a strategic role. Here, the focus shifts completely from individual payment dates and monthly schedules to how payables will change over time. Long-term forecasts have to show how much the business will need to spend to support its goals, and how it will affect liquidity and internal teams.
The long-term methods rely primarily on the main factors that affect AP, such as the percentage of sales or the time it takes to pay suppliers, also known as DPO.
DPO-based forecasting
DPO-based forecasting assumes your business will keep paying suppliers at roughly the same pace it has in the past. It relies on the Days Payable Outstanding (DPO) metric, which measures the average time it takes the company to pay vendors, and applies it to forecasted Cost of Goods Sold (COGS).
Strictly speaking, the DPO forecast isn’t inherently a long-term method, but it’s most useful at that level. It reflects average payment behavior, which isn’t precise enough for short-term forecasts based on individual invoices, but works well for longer-term planning.
To forecast accounts payable with DPO, you can calculate historical DPO from prior periods and apply it to expected spend to estimate the final AP balance you’ll have at a future point in time. For example, if your company typically pays suppliers in about 45 days and spend increases, the unpaid balance also rises.
How to calculate accounts payable with DPO
First, you need to calculate the average DPO. Divide the average accounts payable balance by COGS and multiply by 365 days or the period you’d like to estimate. Here’s the forecast accounts payable formula:
For the sake of this example, let’s assume that the average AP is $1,200,000 and the COGS is $9,600,000.
The company typically pays suppliers 46 days after purchase. Next, divide the forecasted COGS by 365 days and multiply by the assumed DPO you calculated in the previous step.
Let’s say the forecasted COGS for the next year is $10,950,000:
So, if spend increases and the company pays suppliers at the same rate, the AP balance will rise as well. In this case, the company would need an additional $180,000 to maintain the same payment rate.
Best use case: Long-term planning and budgeting.
Not designed for: Precise, invoice-level predictions.
AP as a percentage of purchases
This method projects accounts payable with a simple ratio: AP tends to equal the percentage of purchases, so you apply the same logic to future periods. It’s often used when you don’t have enough data for invoice-level forecasting.
In most cases, the best metric you can rely on is the purchases you have on credit. COGS or total purchases also work, but the predictions might be less precise. Some also calculate AP as a percentage of sales, which is helpful on the surface level but less reliable since selling something doesn’t automatically mean you owe a supplier for it.
How to calculate accounts payable as a percentage of purchases
Use this formula to see how your purchasing volume can affect the accounts payable balance.
For instance, if the business estimates to spend $7,200,000 on purchases in a year and 15% of them remain unpaid at the end, the forecasted AP will equal $1,080,000.
Best use case: High-level budgeting for businesses with predictable purchasing patterns.
Not designed for: Seasonal businesses with rapidly changing purchasing volume.
Regression and trend-based models
Regression and trend models look at past data to see how accounts payable transforms as the business evolves. Teams compare AP to factors such as purchase volume or cost changes, then use those patterns to estimate future balances.
For example, the data might show that specific categories are consistently left unpaid for longer periods due to their payment terms. Such methods give you an understanding of why AP changes, but they don’t estimate when specific invoices will be paid.
Best fit: Long-term planning, especially in larger businesses where many factors affect payables.
Not designed for: Payment scheduling or short-term planning. It’s also unreliable after major changes to the business or payment process because past patterns may no longer apply.
Advanced forecasting model
Timeframe: Ongoing long-term (often 12+ months, refreshed regularly).
Goal: Handle uncertainty and improve forecast accuracy as conditions change.
Once you’ve covered the basics and established simple predictions, it’s time to focus on improvement and explore the cause-and-effect relationships within your financials. The question shifts from How much will we pay and when? to What caused this amount and timing, and how do we make it more effective?
Advanced forecasting models typically rely on historical data. They help teams understand why AP functions the way it does and how different scenarios could affect future balances. These methods don’t replace the typical short-, medium-, or long-term models; rather, they operate based on these assumptions with added variables like scenarios or AI-powered analytics.
Time-series modeling
Time-series modeling forecasts future values by learning patterns from past data. In AP, it uses the company’s historical transactions to predict future outflows. This method is especially useful when accounts payable are predictable and follow repeatable patterns.
There are two common time-series models you can use to understand how to forecast accounts payable:
- The Autoregressive Integrated Moving Average (ARIMA): A time-series model that uses past values and past forecast errors to predict the next values. It’s mainly used to capture trends or irregularities and works best when there are no seasonal patterns.
- The Seasonal Autoregressive Integrated Moving Average (SARIMA): It’s essentially an ARIMA model with a seasonal component that can capture patterns that repeat on a set schedule.
Both models assume that future behavior will largely resemble the past. Because time-series modeling is so complex, it’s typically run in analytics tools (such as Python, R, and BI analytics software) rather than calculated manually.
Best use case: Mid- to long-term AP forecasts with consistent payment patterns and seasonal cycles.
Not designed for: Day-to-day payment decisions or fast-changing businesses.
Scenario modeling
Scenario modeling (also called scenario analysis or what-if modeling) is a planning method that shows how AP payments can change when you adjust a few key assumptions. The team collectively builds several plausible situations, then compares how each affects payables.
Scenario modeling doesn’t rely on a single forecast accounts payable formula. In AP, scenarios usually involve factors that impact the payment cycle, including approval workflows or payment terms. For example, you can model what happens if approvals take three extra days or if suppliers shift from a Net 60 payment system to Net 30.
Below are the core steps for how to forecast accounts payable with scenario modeling:
- Build a baseline forecast by mapping invoices to expected payment dates based on payment terms and approval status.
- Add expected liabilities, including committed spend not yet invoiced.
- Select a small set of variables, such as approval cycle time, invoice volume by category or supplier, and payment-term changes.
- Define 3–5 clear scenarios, including baseline, best-case, and worst-case scenarios.
- Compare weekly or monthly cash outflows to spot the changes.
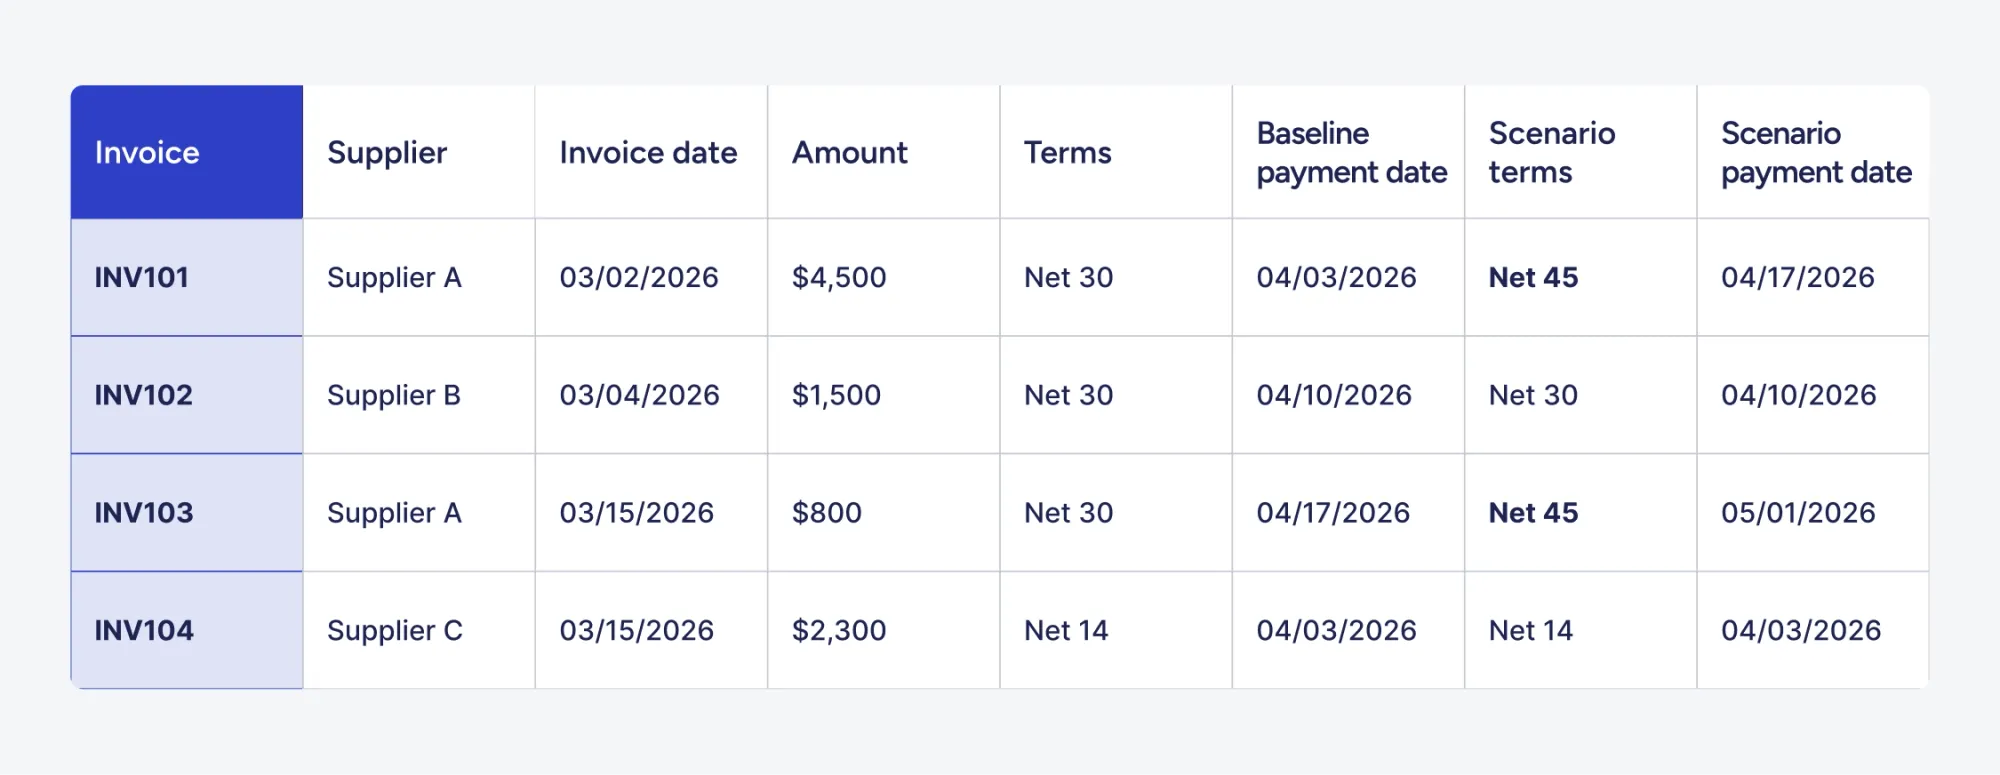
Example of scenario modeling for AP forecasting
In this baseline scenario, the company typically takes two days to approve invoices and pays them in batches on Fridays. The key variable is that Supplier A changed its payment terms from Net 30 to Net 45.
The total balance paid stayed the same at $9,100, but payments were moved to later dates after Supplier A switched from Net 30 to Net 45. $5,300 was pushed to April 17 and May 1, which gives the company more breathing room at the beginning of April.
Best use case: Cash planning and risk management under different scenarios.
Not designed for: Daily payment schedules or incomplete data.
AI-driven predictive analytics
AI-driven predictive analytics uses the company’s historical data to estimate future approvals, payments, and cash outflows. The model learns patterns from data, analyzes them, and predicts outcomes.
The output is often recorded in the form of a probability-based estimate. This type of forecast reflects likelihoods, such as a high chance of delay or early payment, so predictions match what actually happens. Moreover, predictive analytics can estimate more granular details, such as, in our case, the length of the delay.
Best use case: Forecasting AP payment timing and risk with consistent data.
Not designed for: Daily payment execution or teams with unreliable AP data.
Which accounts payable forecasting model fits your company best?
Use this quiz to identify the best way to predict and improve your AP operations.
Find the best AP forecasting method for your purposes
Answer a few questions based on your planning horizon and data maturity. You’ll get the best-fit model from the methods in this section.
How far ahead would you like to forecast?
Choose based on what the company needs now: operational control or strategic visibility.
What outcome would you like to achieve in the next 30 days?
Pick a goal you can directly influence this month.
What’s the biggest constraint of your short-term forecast?
Focus on what impacts your AP processes the most.
What would you like to predict in your mid-term forecast?
Balance both execution-level objectives and strategy for the near future.
What’s the main outcome you want from a long-term AP forecast?
Decide what you would like your payables to be on a strategic level.
Is risk management a priority for your AP team right now?
If your team experiences frequent changes, payment risk is higher.
—
—
Best For
—
How To Use It
—
Not Designed For
—
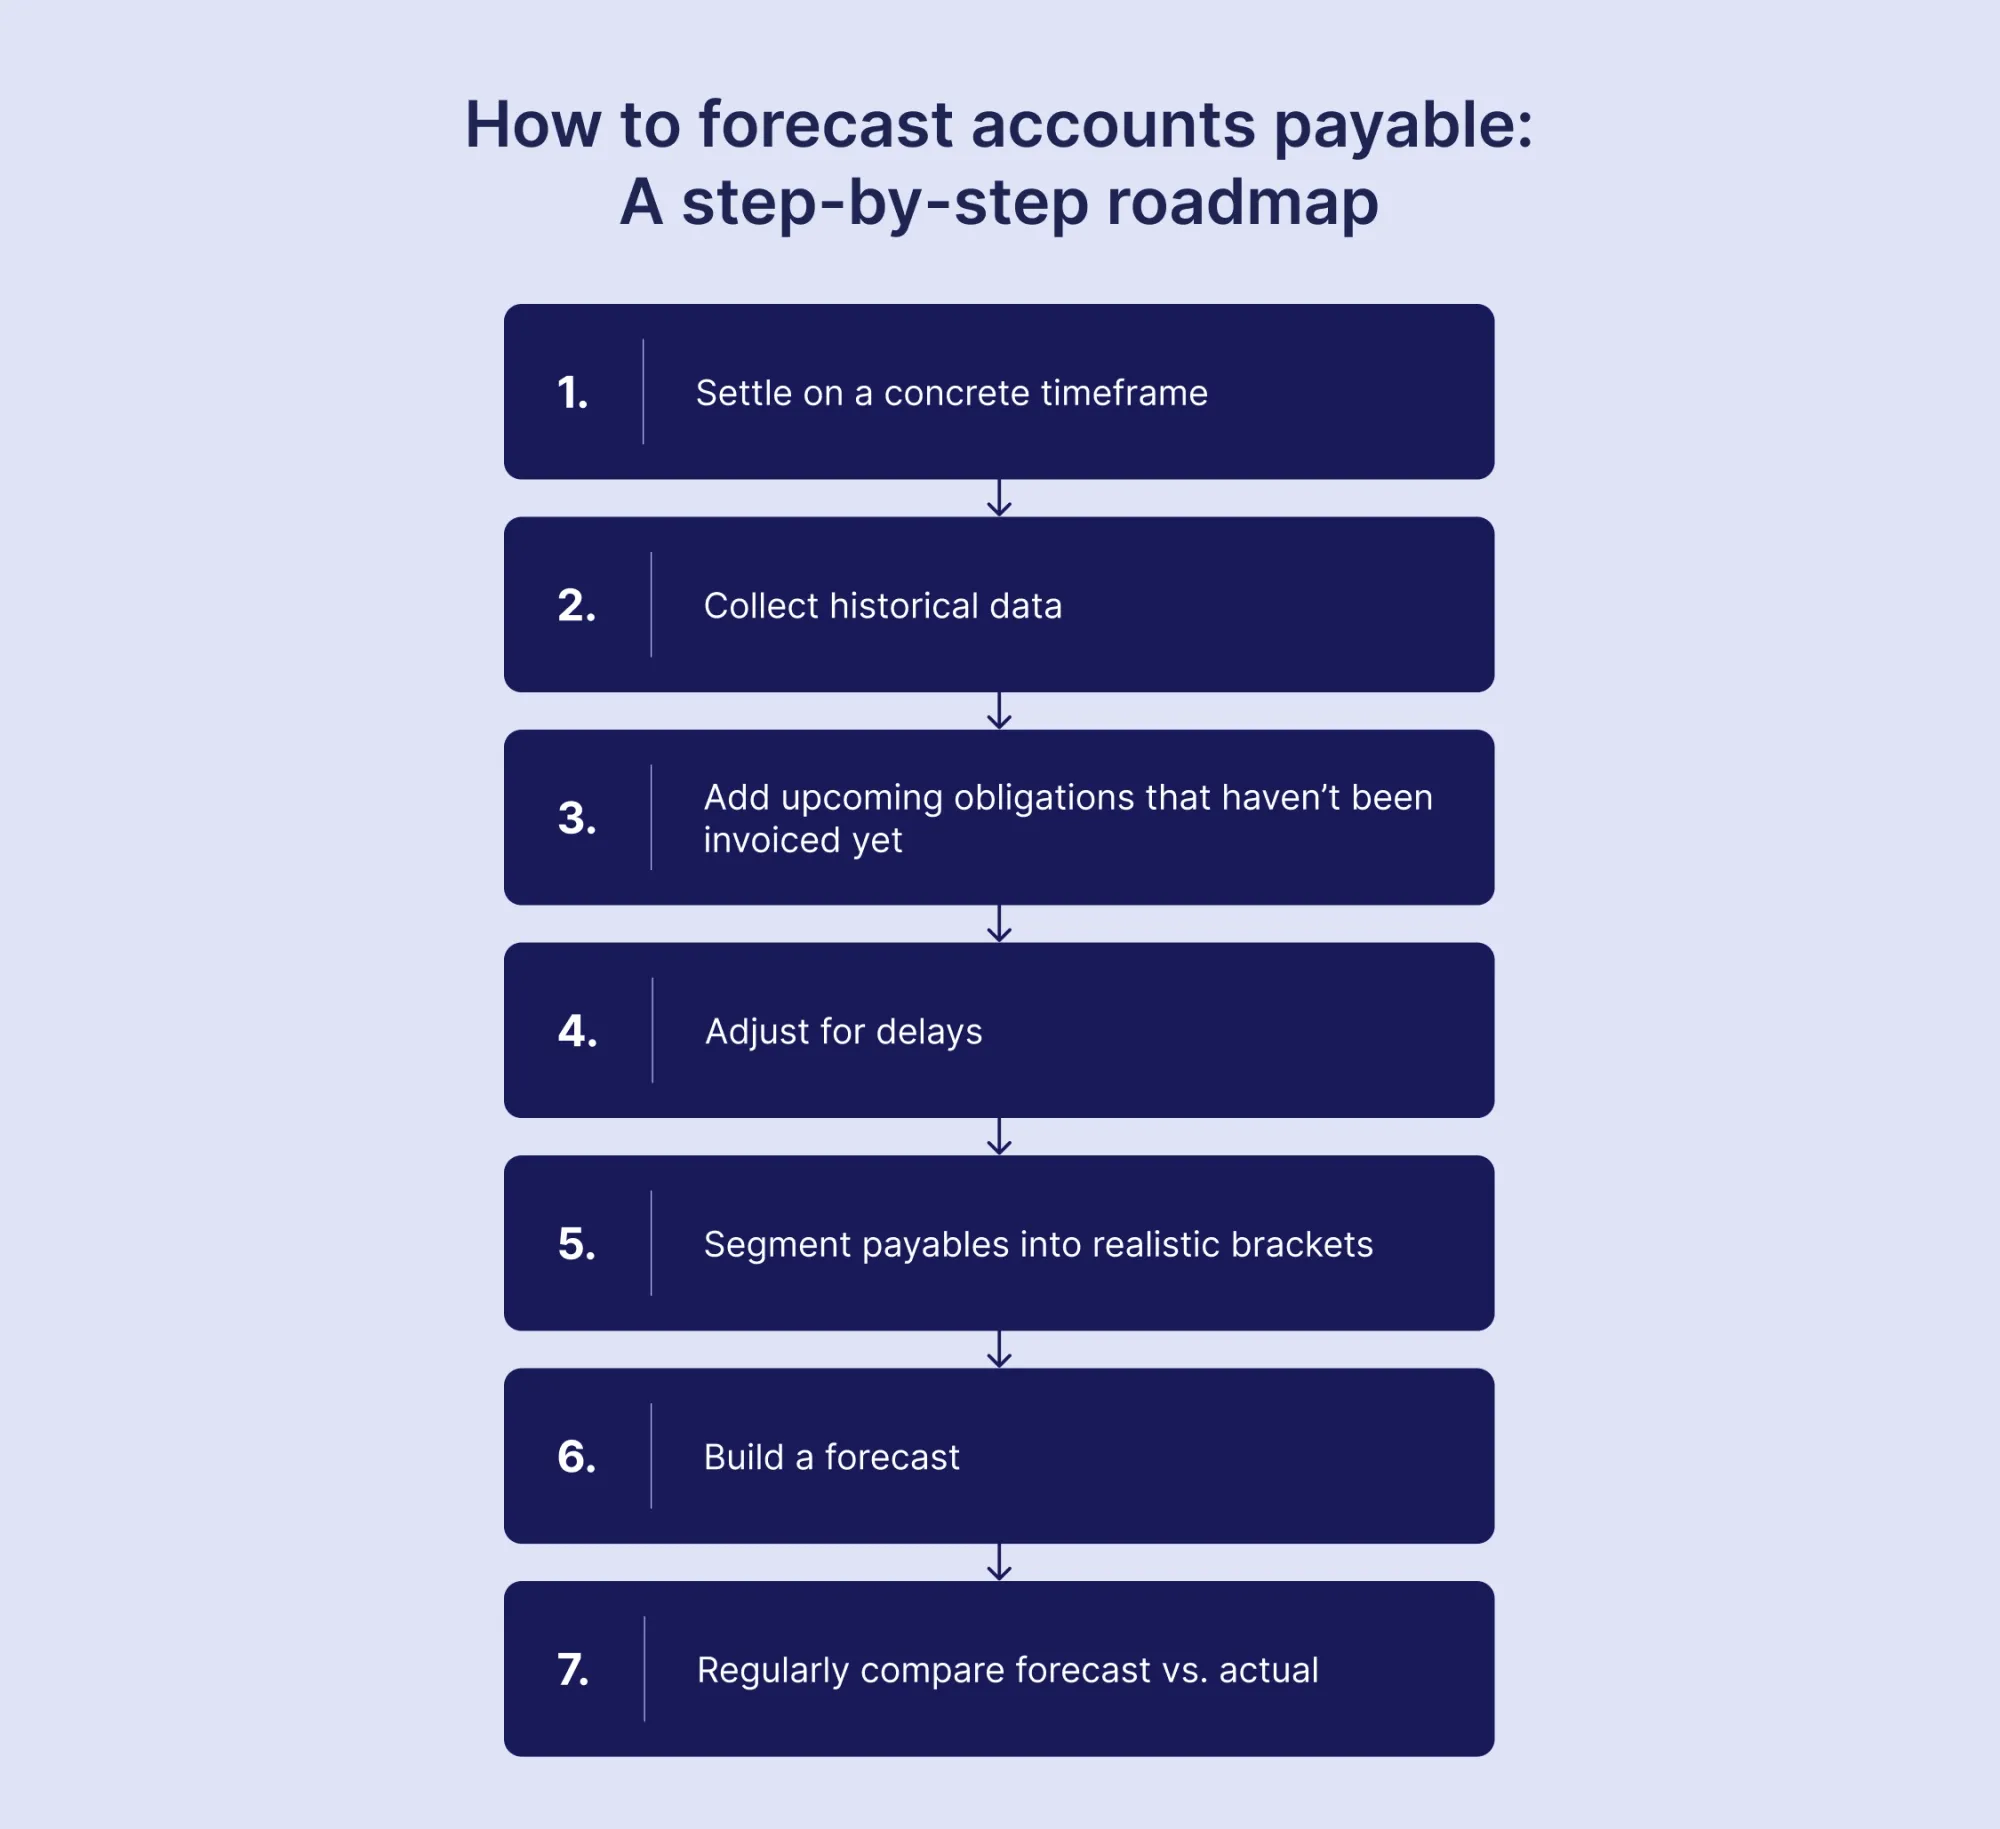
How to forecast accounts payable: A step-by-step roadmap
AP forecasting begins with careful preparation and a definite understanding of what you’d like to achieve. Follow a step-by-step process to build a usable forecast:
1. Settle on a concrete timeframe
To accurately forecast accounts payable, you should decide exactly how far ahead you’re planning. Some methods and tools you’re likely to use require definite data from a specific period. For instance, using DPO to forecast next week’s payments is ineffective since it helps estimate the average AP balance, not specific transactions. Additionally, the approach itself may differ: short-term predictions often lead to quick decisions, while long-term ones are incorporated into the overall strategy.
2. Collect historical data
Review your historical data from the last payment cycle. Typically, it’s best to have a complete overview of a 12-to 24-month period, as this timeframe includes seasonal spikes and recurring year-end expenses. Key data points that should be included:
- Invoice and payment due dates, with the latter being the main focus. The instinct is usually to forecast based on invoice deadlines, but they don’t always account for internal bottlenecks.
- Vendor names, which will help you accurately predict the amounts and timing of payments to each vendor.
- Invoice amount. Even small timing shifts matter more when large sums are involved. Knowing amounts at the invoice level helps prioritize approvals and plan payment sequencing.
- Early-payment discount history, which shows whether discounts are actually used.
- Payment terms, which set the payment dates. May include terms like Net 30, Net 60, and Net 90.
If you don’t have a centralized data source, this step can easily stall the entire process. AP automation systems like Precoro centralize all purchasing data in a single location and easily integrate with your preferred accounting solution, either via API or direct integration. That way, your invoices aren’t getting lost in spreadsheets but are visible on a single screen.
3. Add upcoming obligations that haven’t been invoiced yet
The invoices that have already arrived don’t show the entire picture. Some APs might mistakenly include only unpaid ones in their forecasts. However, any upcoming obligations that you already negotiated or even partially completed will also have an impact on how much and when you pay. Include:
- Approved purchase orders. Approval is key here—unapproved POs might still be rejected and skew the forecast if included.
- Goods received but not invoiced (GRNI). These are likely to become invoices, but the timing depends on supplier billing cycles and any disputes.
- Recurring charges. Subscriptions, contracted services, rent, and similar repeat payments should be included based on expected billing dates.
Then estimate when these items typically get invoiced and apply payment terms to project when funds are likely to leave your company’s bank account.
4. Adjust for delays
Invoices aren’t always paid on their exact due dates, especially during busy holiday periods or at the year-end. Some companies prefer to pay in batches on scheduled dates. In other cases, approvals might take longer because of disputes or availability. To learn how to project accounts payable accurately, teams should focus on:
- Typical approval timelines: How fast do invoices for certain purchase categories move forward?
- Common exceptions: How often and which categories or departments are plagued by them?
- Payment schedule: When do you typically pay invoices?
5. Segment payables into realistic brackets
AP forecasts fail when invoices with very different processing and payment patterns are modeled the same way. Segmenting payables means you can estimate payment timing based on each category’s approval and payment trends. Common segments include:
- PO-backed vs. non-PO invoices
PO-backed invoices typically go through a 2- or a 3-way match and a standard approval workflow. On the other hand, non-PO invoices often require additional manual review, so the forecast needs to account for that time. - Recurring vs. non-recurring invoices
Recurring bills like rent and subscriptions typically arrive on a predetermined date and easily pass the approval process. One-time purchases might have a unique set of steps, depending on the situation. These can be forecasted based on historical transaction behavior in the same category, or with a buffer. - High-value suppliers vs. tail spend
A small group of suppliers usually makes up most of the company’s payable amount, and their invoices tend to follow clear rules and approval paths. Invoices from tail-spend suppliers are typically less prioritized and might follow a less predictable schedule. Forecasting these groups separately prevents low-value purchases from distorting the timing of high-value ones.
6. Build a forecast
Once payables are segmented and the data baseline is clean, the next step is to turn those inputs into a forecast model that the team can actually maintain.
Smaller teams often start with a structured spreadsheet, usually an accounts payable forecast template in Excel, where they list expected payment dates by supplier or category and link them to invoices or approved POs. However, as organizations scale, they quickly outgrow this approach. Larger companies usually connect their forecasting tool directly to accounting or ERP systems, so status, approvals, and payments update automatically.
At this point, you also need to look beyond the invoices already in AP. A valid forecast has to account for any planned projects or purchasing activities. If sales are expected to grow, supplier spend also increases, even before the first invoices show up.
7. Regularly compare forecast vs. actual
An AP forecast doesn’t improve on its own. The first attempts might not be perfect, so the team should regularly compare what they expected to pay (the forecast) with what they actually paid (the actuals). Note down each variance and its reason, and consider them when compiling your next estimates.
FAQ about accounts payable forecasting
AP forecasting is the practice of estimating when and how much money will go to suppliers, based on open invoices, payment terms, and prior payment patterns. A solid AP forecast also reflects real process signals such as approval status, exceptions, and pay-run dates.
Cash flow forecasting examines the full flow of cash across the business, including customer payments, supplier payments, payroll, taxes, and financing activity. Accounts payable forecasting focuses on one specific part of that picture: supplier payments and their timing. The output of an AP forecast usually feeds into the payables section of a broader cash flow forecast.
To understand how to forecast accounts payable balance with Days Payable Outstanding (DPO), apply the company’s historical DPO to your expected spend, often COGS. If expenses increase while payment behavior stays consistent, the AP balance rises as well.
Only the portion of OPEX that results in supplier invoices should be included in an accounts payable forecast. Costs like payroll or taxes are usually accrued separately and don’t follow the same payment schedule. For short-term AP payment forecasts, keep the focus on invoice-backed spend.
An accurate forecast needs reliable data. How to project accounts payable comes down to four inputs: existing invoices, payment schedules, committed purchases, and historical data. Open invoices with payment terms and precise amounts serve as the core of all predictions. Payment run schedules matter too, since they often determine when the business can actually pay invoices. Any committed spend, such as approved purchase orders and goods already received but not yet invoiced, should be included. Historical patterns matter too since they support any assumptions in the forecast.
How AP automation with Precoro makes forecasts foolproof
No matter how hard you try, you can’t make forecasting 100% accurate. But procurement centralization and procurement software like Precoro can certainly make it far more reliable with a single source of truth. It solves the main causes behind the inaccuracy: late invoice capture, manual 3-way matching, unclear statuses, and missing links between POs and invoices. Here are the features that make Precoro a great data foundation for accounts payable forecasting:
- AI-powered OCR for invoice capture: Precoro extracts all the necessary data from the document with Google AI OCR and turns it into a ready-to-use invoice.
- AP Inbox for invoice intake: All invoices and matching POs or receipts are stored in one place. Your team no longer has to scramble through inboxes and shared folders for a correct document.
- E-invoicing support: Precoro offers e-invoice processing for France, Belgium, Mexico, and Germany, with more countries in development.
- Automated 3-way matching: Our system cross-checks invoices against POs and receipts to spot exceptions early in the process.
- Budget enforcement and spend controls: You can enforce budgets and track spend down to the department and project, not just the whole company. With such granular control, there are fewer off-contract purchases that can skew the forecast.
- Multi-entity workflows: Precoro supports multi-entity management. Separate workflows by business unit so each forecast reflects how that entity actually pays suppliers.
- Native integrations with accounting systems and ERPs: No need to get rid of existing tools you’ve grown used to. Connect them easily to Precoro through native integrations or API connections. Data updates automatically between systems, which keeps forecasts accurate and up-to-date.
See how Precoro turns real AP data into forecasts you can actually trust.


